## Line Chart: Accuracy vs. Sample Size (k)
### Overview
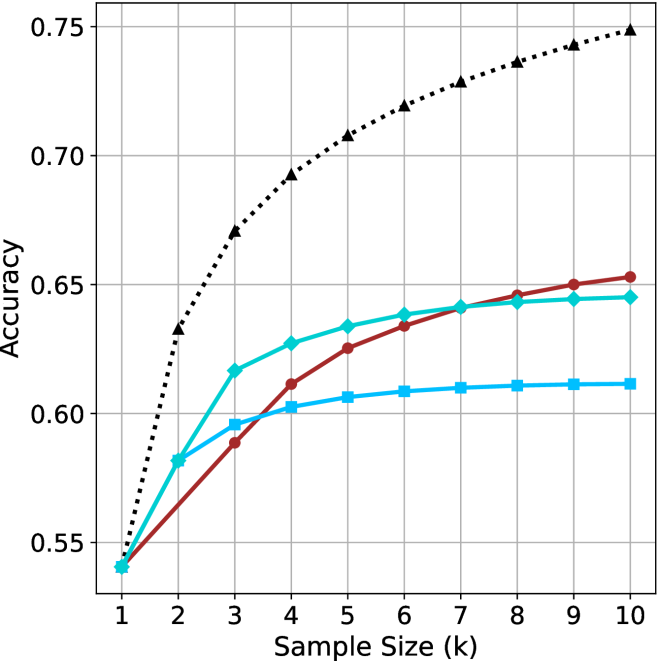
The chart illustrates the relationship between sample size (k) and accuracy for three distinct methods (A, B, C). Accuracy is measured on a scale from 0.55 to 0.75, with sample sizes ranging from 1 to 10. Three data series are plotted: a black dotted line (Method A), a red solid line (Method B), and a blue solid line (Method C). The legend is positioned in the top-right corner, associating colors and markers with their respective methods.
### Components/Axes
- **X-axis (Sample Size, k)**: Labeled "Sample Size (k)" with integer markers from 1 to 10.
- **Y-axis (Accuracy)**: Labeled "Accuracy" with increments of 0.05, ranging from 0.55 to 0.75.
- **Legend**: Located in the top-right corner, mapping:
- Black dotted line with triangle markers → Method A
- Red solid line with circle markers → Method B
- Blue solid line with square markers → Method C
### Detailed Analysis
1. **Method A (Black Dotted Line)**:
- Starts at (1, 0.55) and increases monotonically.
- Reaches approximately 0.75 at k=10.
- Key points:
- k=1: 0.55
- k=2: 0.60
- k=3: 0.65
- k=4: 0.68
- k=5: 0.70
- k=6: 0.72
- k=7: 0.73
- k=8: 0.74
- k=9: 0.74
- k=10: 0.75
2. **Method B (Red Solid Line)**:
- Begins at (1, 0.55) and rises gradually.
- Plateaus near 0.65 by k=10.
- Key points:
- k=1: 0.55
- k=2: 0.58
- k=3: 0.60
- k=4: 0.62
- k=5: 0.63
- k=6: 0.64
- k=7: 0.64
- k=8: 0.64
- k=9: 0.65
- k=10: 0.65
3. **Method C (Blue Solid Line)**:
- Starts at (1, 0.55) with a sharp initial increase.
- Levels off around 0.62 by k=5 and remains stable.
- Key points:
- k=1: 0.55
- k=2: 0.59
- k=3: 0.62
- k=4: 0.62
- k=5: 0.62
- k=6: 0.62
- k=7: 0.62
- k=8: 0.62
- k=9: 0.62
- k=10: 0.62
### Key Observations
- **Method A** demonstrates the steepest and most consistent improvement in accuracy as sample size increases, suggesting superior scalability.
- **Method B** shows moderate improvement but plateaus earlier than Method A, indicating diminishing returns at larger sample sizes.
- **Method C** exhibits rapid initial gains but stabilizes at a lower accuracy threshold (0.62) regardless of further increases in sample size.
- All methods share the same starting accuracy (0.55) at k=1, implying similar baseline performance.
### Interpretation
The data suggests that **Method A** is the most effective for improving accuracy with increasing sample size, making it ideal for applications requiring high precision. **Method B** offers a balanced trade-off between computational cost and accuracy, while **Method C** may be less efficient for large datasets due to its early plateau. The convergence of Method B and C at higher sample sizes highlights potential limitations in their scalability compared to Method A. The consistent starting point across all methods implies that initial conditions (e.g., data quality, preprocessing) are uniform, and differences emerge primarily from algorithmic design.