# Technical Document Extraction: Control Value Analysis
## Title
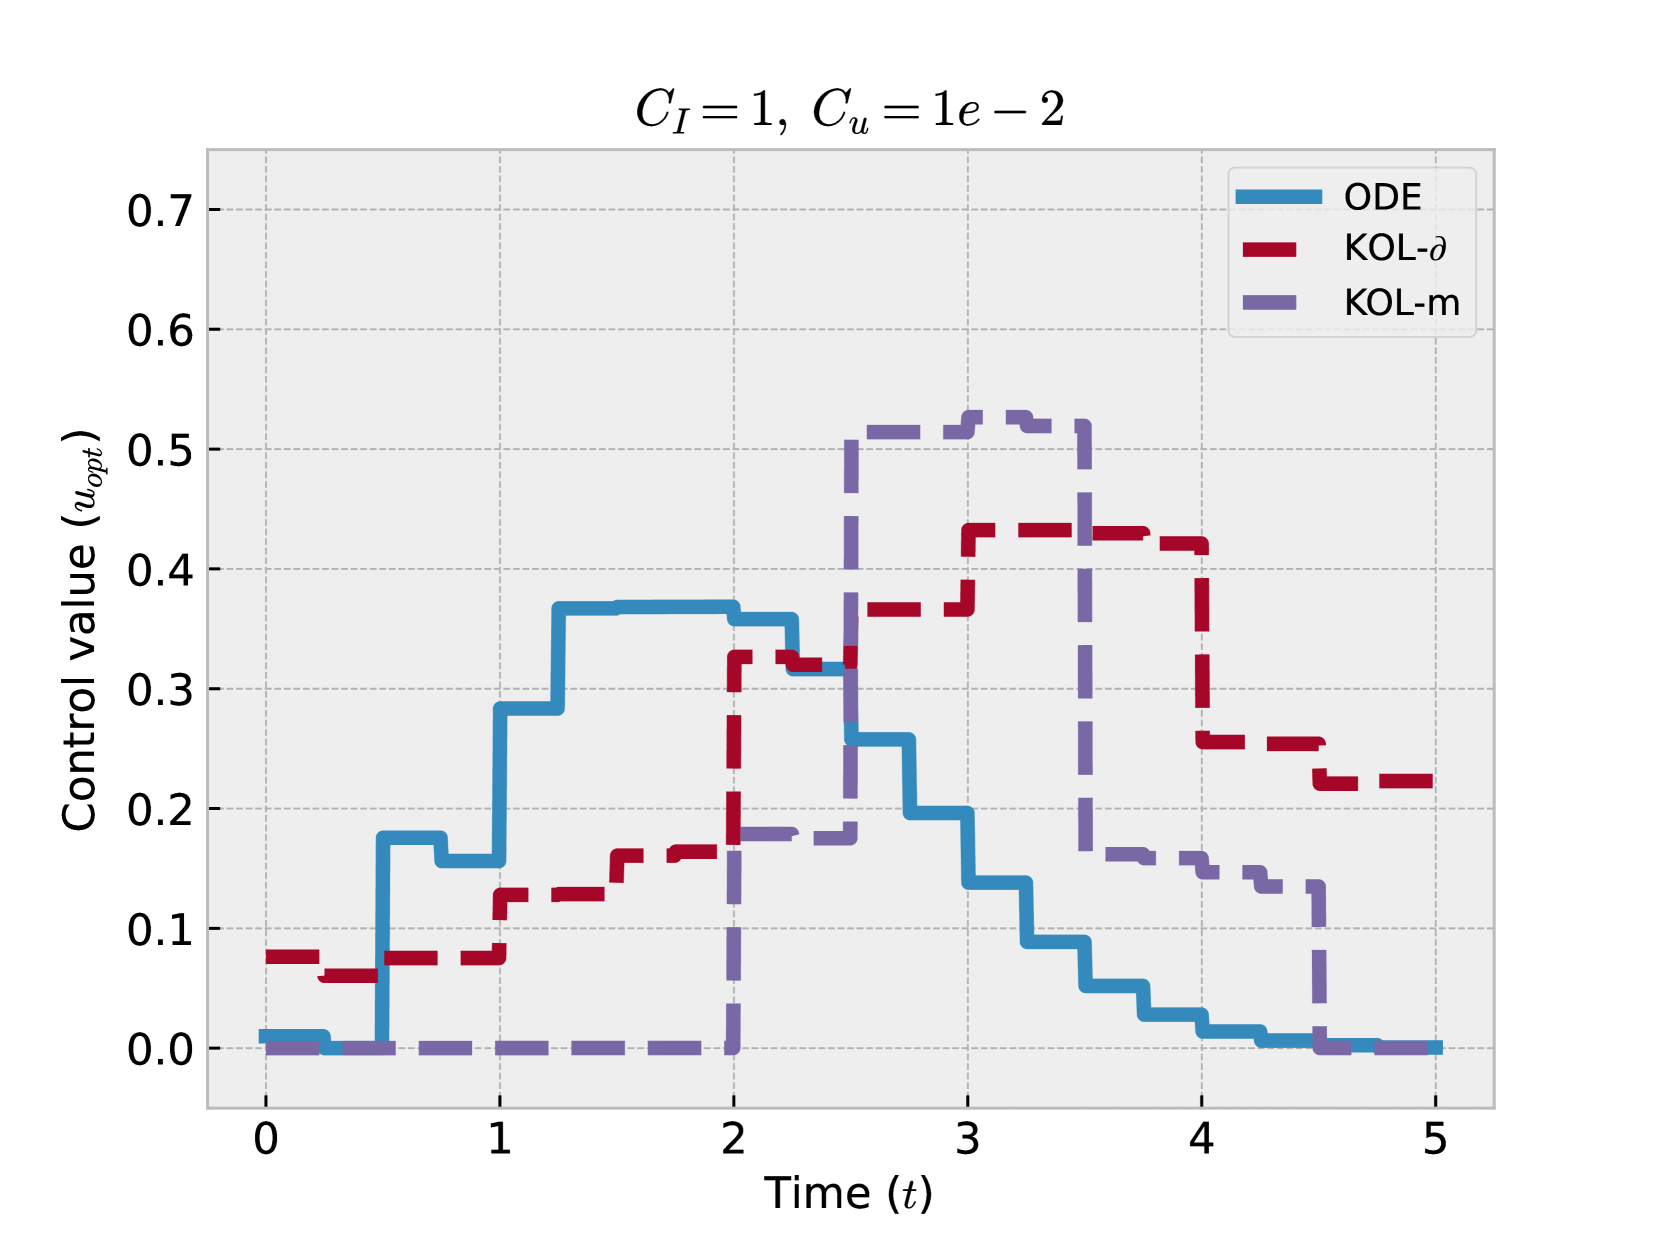
Control Value Analysis with Parameters:
**CI = 1**, **Cu = 1e-2**
---
## Axis Labels
- **X-axis**: Time (t)
- Range: 0 to 5 (increments of 1)
- **Y-axis**: Control value (u_opt)
- Range: 0 to 0.7 (increments of 0.1)
---
## Legend
| Color | Label |
|--------|-----------|
| Blue | ODE |
| Red | KOL-δ |
| Purple | KOL-m |
---
## Key Trends and Data Points
### ODE (Blue Line)
1. **Initial State**: Starts at 0.0 at t=0.
2. **First Jump**: Rises to 0.2 at t=1.
3. **Second Jump**: Increases to 0.4 at t=1.5.
4. **Drop**: Decreases to 0.3 at t=2.5.
5. **Final Drop**: Falls to 0.0 at t=5.
### KOL-δ (Red Line)
1. **Initial State**: Starts at 0.05 at t=0.
2. **First Jump**: Rises to 0.15 at t=1.
3. **Second Jump**: Increases to 0.3 at t=2.
4. **Drop**: Decreases to 0.2 at t=3.
5. **Final State**: Ends at 0.25 at t=5.
### KOL-m (Purple Line)
1. **Initial State**: Starts at 0.0 at t=0.
2. **First Jump**: Rises to 0.2 at t=2.
3. **Peak**: Reaches 0.5 at t=3.
4. **Drop**: Decreases to 0.1 at t=4.
5. **Final State**: Ends at 0.0 at t=5.
---
## Critical Observations
1. **ODE** exhibits stepwise behavior with sharp transitions.
2. **KOL-δ** shows gradual increases and decreases with a plateau at t=3.
3. **KOL-m** has the highest peak (0.5) at t=3, followed by a sharp decline.
4. All strategies converge to 0.0 by t=5, except KOL-δ, which stabilizes at 0.25.
---
## Parameters
- **CI = 1**: Likely a coupling or interaction coefficient.
- **Cu = 1e-2**: Possibly a control update rate or damping factor.
---
## Notes
- The graph uses dashed lines for KOL-δ and KOL-m, while ODE is solid.
- All lines are plotted on a Cartesian coordinate system with gridlines for clarity.
- No overlapping data points are observed between strategies.