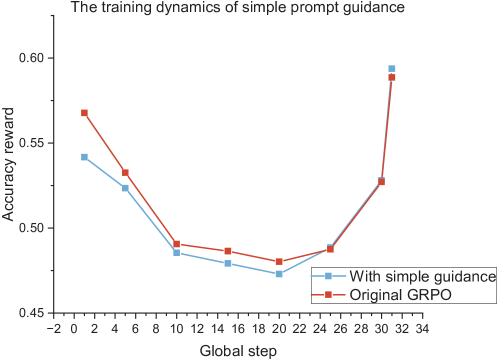
## Line Chart: Training Dynamics of Simple Prompt Guidance
### Overview
This is a line chart titled "The training dynamics of simple prompt guidance." It plots the "Accuracy reward" (y-axis) against the "Global step" (x-axis) for two different training methods over the course of approximately 32 steps. The chart demonstrates a comparative performance trend, showing an initial decline followed by a significant recovery and increase for both methods.
### Components/Axes
* **Chart Title:** "The training dynamics of simple prompt guidance" (centered at the top).
* **Y-Axis:**
* **Label:** "Accuracy reward" (rotated vertically on the left).
* **Scale:** Linear scale ranging from 0.45 to 0.60.
* **Major Ticks:** 0.45, 0.50, 0.55, 0.60.
* **X-Axis:**
* **Label:** "Global step" (centered at the bottom).
* **Scale:** Linear scale ranging from -2 to 34.
* **Major Ticks:** -2, 0, 2, 4, 6, 8, 10, 12, 14, 16, 18, 20, 22, 24, 26, 28, 30, 32, 34.
* **Legend:**
* **Position:** Bottom-right corner of the chart area, slightly overlapping the plot.
* **Items:**
1. **Blue line with square markers:** "With simple guidance"
2. **Red line with square markers:** "Original GRPO"
### Detailed Analysis
The chart tracks two data series. The visual trend for both is a distinct "U" or "check-mark" shape: a decline in the first half of training, a trough in the middle, and a sharp rise in the final steps.
**1. Data Series: "With simple guidance" (Blue Line)**
* **Trend:** Starts at a moderate value, declines steadily to a minimum around step 20, then rises sharply, ending at the highest point on the chart.
* **Approximate Data Points:**
* Step 0: ~0.542
* Step 4: ~0.525
* Step 10: ~0.485
* Step 15: ~0.480
* Step 20: ~0.475 (Approximate minimum)
* Step 25: ~0.490
* Step 30: ~0.528
* Step 32: ~0.595 (Approximate maximum)
**2. Data Series: "Original GRPO" (Red Line)**
* **Trend:** Follows a nearly identical pattern to the blue line but starts higher and ends slightly lower. It also declines, troughs, and then experiences a late, sharp increase.
* **Approximate Data Points:**
* Step 0: ~0.570
* Step 4: ~0.532
* Step 10: ~0.492
* Step 15: ~0.488
* Step 20: ~0.482 (Approximate minimum)
* Step 25: ~0.490 (Converges with blue line)
* Step 30: ~0.528 (Converges with blue line)
* Step 32: ~0.590
### Key Observations
1. **Parallel Trajectories:** The two lines are remarkably parallel for most of the training process, suggesting the underlying training dynamics are similar regardless of the guidance method.
2. **Performance Crossover:** The "Original GRPO" (red) starts with a higher accuracy reward. The "With simple guidance" (blue) method starts lower but ends at a slightly higher final value (~0.595 vs. ~0.590).
3. **Convergence Point:** The two lines appear to converge and overlap almost exactly between Global steps 25 and 30.
4. **Late-Stage Spike:** The most dramatic feature is the very sharp, near-vertical increase in accuracy reward for both methods after step 30, suggesting a significant event or phase change in the training process at that point.
5. **Mid-Training Trough:** Both methods experience their lowest performance around step 20, indicating a challenging period in the middle of the training run.
### Interpretation
The data suggests that the "simple prompt guidance" method modifies the training trajectory of the Original GRPO algorithm but does not fundamentally alter its learning dynamics. Both methods follow the same pattern of initial performance degradation followed by recovery.
The key finding is the **late-stage performance spike**. This could indicate:
* A delayed effect of the guidance mechanism finally taking hold.
* The model reaching a critical capacity or discovering a more efficient solution pathway after a period of exploration (the trough).
* A potential artifact of the training schedule, such as a learning rate change or the introduction of a new data phase around step 30.
The fact that the guided method ends with a marginally higher reward, despite starting lower, implies it may offer a slight long-term benefit, though the difference is small. The convergence in the middle suggests that for a significant portion of training, the guidance has a negligible effect on the measured accuracy reward. The chart effectively demonstrates that the guidance influences the starting point and the final peak but not the overall shape of the learning curve.