## Line Chart: The training dynamics of simple prompt guidance
### Overview
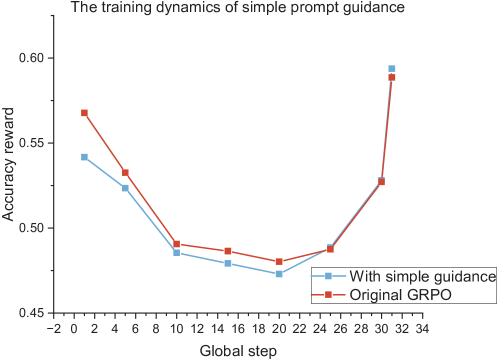
The chart compares the accuracy reward of two methods ("With simple guidance" and "Original GRPO") across global training steps (-2 to 34). Both methods show distinct trajectories, with "With simple guidance" demonstrating a more stable improvement pattern.
### Components/Axes
- **X-axis (Global step)**: Ranges from -2 to 34 in increments of 2. Ticks labeled at -2, 0, 2, ..., 34.
- **Y-axis (Accuracy reward)**: Scaled from 0.45 to 0.60 in increments of 0.05.
- **Legend**: Located at bottom-right, with:
- Blue squares: "With simple guidance"
- Red squares: "Original GRPO"
### Detailed Analysis
1. **With simple guidance (Blue line)**:
- Starts at ~0.54 at x=-2
- Drops to ~0.48 at x=4
- Further declines to ~0.47 at x=10
- Reaches ~0.46 at x=20
- Sharp increase to ~0.58 at x=34
2. **Original GRPO (Red line)**:
- Begins at ~0.57 at x=-2
- Falls to ~0.53 at x=4
- Declines to ~0.49 at x=10
- Drops to ~0.48 at x=20
- Sharp rise to ~0.59 at x=34
### Key Observations
- Both methods show a **U-shaped trajectory**, with initial decline followed by recovery.
- "With simple guidance" maintains **higher stability** during the decline phase (smaller drops between x=4 and x=20).
- Final accuracy rewards:
- With simple guidance: ~0.58
- Original GRPO: ~0.59
- The **steepest increase** occurs between x=20 and x=34 for both methods.
### Interpretation
The data suggests that simple prompt guidance introduces **stabilizing effects** during early training phases, reducing performance volatility. While both methods converge at similar final accuracy levels (~0.58-0.59), the blue line's smoother trajectory implies better generalization or robustness to training noise. The sharp final ascent in both lines may indicate a critical adaptation phase or parameter optimization breakthrough. The x-axis starting at -2 is unusual but does not affect the relative comparison between methods.