## Histogram: Distribution of Gallery Sizes (Similarity Threshold = 0.3)
### Overview
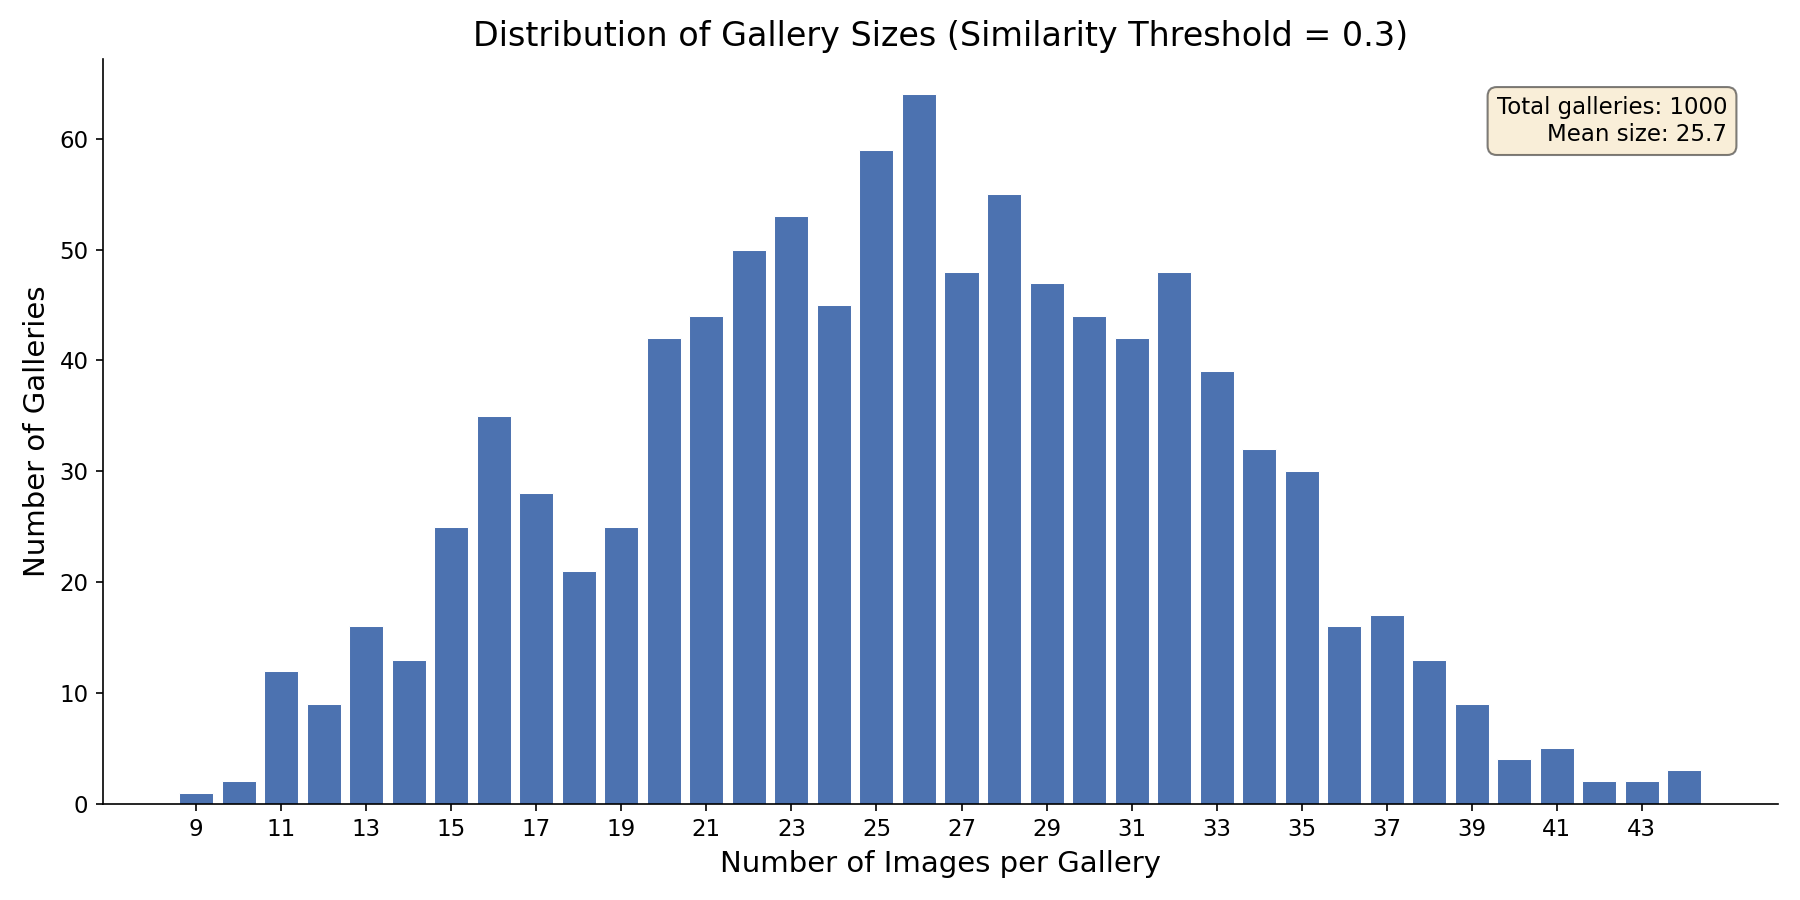
The image displays a histogram visualizing the distribution of gallery sizes based on a similarity threshold of 0.3. The x-axis represents the "Number of Images per Gallery," while the y-axis shows the "Number of Galleries." The chart includes a legend with total galleries (1000) and mean gallery size (25.7). The distribution is skewed, with a peak around 25-27 images per gallery.
### Components/Axes
- **Title**: "Distribution of Gallery Sizes (Similarity Threshold = 0.3)"
- **X-axis**:
- Label: "Number of Images per Gallery"
- Range: 9 to 43 (increments of 2)
- Categories: 9, 11, 13, ..., 43
- **Y-axis**:
- Label: "Number of Galleries"
- Range: 0 to 60 (increments of 10)
- **Legend**:
- Position: Top-right corner
- Text: "Total galleries: 1000" and "Mean size: 25.7"
- **Bars**:
- Color: Blue (uniform across all bars)
- Height: Varies, with the tallest bar at ~60 galleries for 25-27 images per gallery.
### Detailed Analysis
- **X-axis Values**:
- Galleries with 9-11 images: ~1-10 galleries
- Galleries with 13-15 images: ~10-20 galleries
- Galleries with 17-19 images: ~20-30 galleries
- Galleries with 21-23 images: ~40-50 galleries
- Galleries with 25-27 images: ~55-60 galleries (peak)
- Galleries with 29-31 images: ~40-50 galleries
- Galleries with 33-35 images: ~30-40 galleries
- Galleries with 37-39 images: ~10-20 galleries
- Galleries with 41-43 images: ~1-5 galleries
- **Y-axis Values**:
- Heights correspond to the number of galleries for each image count (e.g., ~60 galleries have 25-27 images).
### Key Observations
1. **Peak Distribution**: The highest frequency of galleries (60) occurs at 25-27 images per gallery.
2. **Skewed Distribution**: Fewer galleries have very low (<15 images) or very high (>35 images) image counts.
3. **Mean Size**: The mean gallery size (25.7) aligns with the peak, suggesting most galleries cluster around this range.
4. **Threshold Context**: The similarity threshold of 0.3 likely groups galleries with comparable image content, though the exact methodology is not explained.
### Interpretation
The data suggests that most galleries (60 out of 1000) contain 25-27 images, indicating a common operational or curatorial standard. The distribution’s skew implies that smaller galleries (<15 images) and larger galleries (>35 images) are less common, possibly due to resource constraints or curation strategies. The similarity threshold of 0.3 may reflect a clustering algorithm used to categorize galleries, but its impact on the distribution is not explicitly detailed. This histogram could inform decisions about resource allocation, content curation, or algorithmic adjustments to optimize gallery sizes.