## Diagram: Teacher-Student Learning Model with Relevant and Irrelevant Features
### Overview
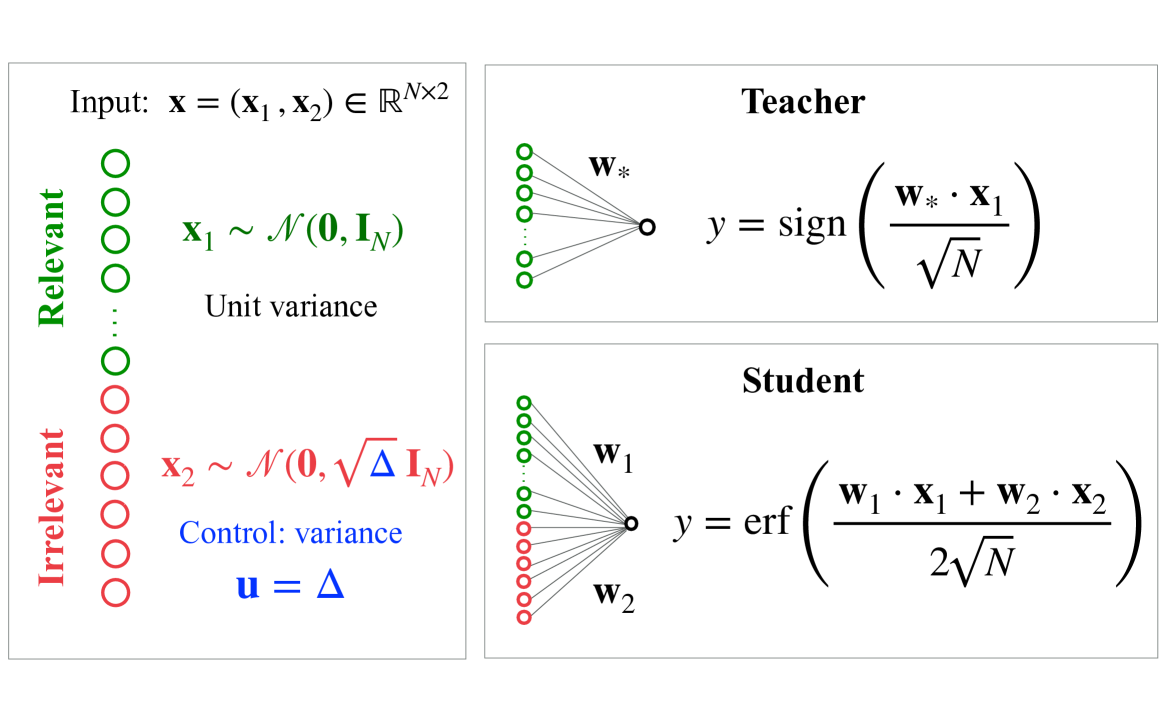
The image is a technical diagram illustrating a machine learning or statistical learning setup. It defines an input vector composed of relevant and irrelevant components and shows two models: a "Teacher" model that uses only the relevant features and a "Student" model that uses both relevant and irrelevant features. The diagram is structured into three distinct panels.
### Components/Axes
The diagram is divided into three rectangular panels with black borders.
1. **Left Panel (Input Definition):**
* **Title/Header:** `Input: x = (x₁, x₂) ∈ ℝᴺˣ²`
* **Visual Elements:** A vertical column of circles representing input features.
* Top section: 7 green circles labeled vertically as **"Relevant"**.
* Bottom section: 7 red circles labeled vertically as **"Irrelevant"**.
* **Mathematical Definitions:**
* For the relevant component: `x₁ ~ 𝒩(0, I_N)` with the annotation "Unit variance".
* For the irrelevant component: `x₂ ~ 𝒩(0, √Δ I_N)`.
* A control parameter is defined: `u = Δ` with the annotation "Control: variance" in blue text.
2. **Top-Right Panel (Teacher Model):**
* **Title/Header:** **"Teacher"**
* **Visual Elements:** A schematic of a single-layer neural network or linear classifier.
* Input: A column of 5 green circles (representing the relevant features `x₁`).
* Weights: Labeled `w*`.
* Output: A single circle.
* **Mathematical Formula:** `y = sign( (w* · x₁) / √N )`
3. **Bottom-Right Panel (Student Model):**
* **Title/Header:** **"Student"**
* **Visual Elements:** A schematic of a single-layer neural network or linear classifier.
* Input: A column of 5 green circles (relevant features `x₁`) and 5 red circles (irrelevant features `x₂`).
* Weights: Labeled `w₁` (connecting to green inputs) and `w₂` (connecting to red inputs).
* Output: A single circle.
* **Mathematical Formula:** `y = erf( (w₁ · x₁ + w₂ · x₂) / (2√N) )`
### Detailed Analysis
* **Input Structure:** The input `x` is a matrix in `ℝᴺˣ²`, meaning it has `N` samples (or dimensions) and 2 feature groups. The two groups are statistically independent.
* **Relevant Features (`x₁`):** Drawn from a standard multivariate normal distribution with zero mean and identity covariance matrix `I_N`, implying unit variance and no correlation between features.
* **Irrelevant Features (`x₂`):** Drawn from a multivariate normal distribution with zero mean and a scaled covariance matrix `√Δ I_N`. The variance of each feature is controlled by the parameter `Δ` (Delta), which is also defined as the control variable `u`.
* **Teacher Model:** This model represents the "true" or ideal process. It generates labels `y` using only the relevant features `x₁`. The output is the sign of the normalized dot product between a fixed weight vector `w*` and `x₁`. The normalization factor is `√N`.
* **Student Model:** This model attempts to learn the task. It has access to both relevant (`x₁`) and irrelevant (`x₂`) features, with separate weight vectors `w₁` and `w₂`. Its output uses the error function (`erf`) applied to a normalized sum of the weighted inputs. The normalization factor here is `2√N`.
### Key Observations
1. **Color Coding:** A consistent color scheme is used: green for relevant components (`x₁`, its weights `w*`/`w₁`, and its circles) and red for irrelevant components (`x₂`, its weights `w₂`, and its circles). Blue is used for the control parameter `u = Δ`.
2. **Model Asymmetry:** The Teacher model is simpler, using a `sign` function and only relevant inputs. The Student model is more complex, using a smooth `erf` activation function and all inputs.
3. **Normalization:** Both models normalize their weighted sums by factors involving `√N`, but the Student's denominator (`2√N`) is twice as large as the Teacher's (`√N`).
4. **Spatial Layout:** The input definition is on the left, feeding conceptually into the two model panels on the right. The Teacher is positioned above the Student, suggesting a hierarchy or reference relationship.
### Interpretation
This diagram outlines a controlled experimental setup for studying learning in the presence of noise or irrelevant features. The core investigation appears to be: **How does the variance (Δ) of irrelevant features affect a student model's ability to learn from relevant features when a teacher model provides labels based solely on those relevant features?**
* **The Teacher** represents the ground truth or optimal predictor, which is invariant to the irrelevant features `x₂`.
* **The Student** must learn the task but is "distracted" by the irrelevant features. The parameter `Δ` controls the strength of this distraction. When `Δ = 0`, the irrelevant features have zero variance (are constant), and the student's problem reduces to the teacher's. As `Δ` increases, the irrelevant features become more variable and potentially more harmful to learning.
* The use of different activation functions (`sign` vs. `erf`) may be intentional to study the effect of model mismatch or the properties of different loss landscapes.
* This setup is characteristic of research in statistical learning theory, generalization, double descent, or the study of benign vs. harmful overfitting, where researchers analyze how model performance (e.g., generalization error) changes as a function of the noise level (`Δ`) and the number of parameters or samples (`N`).