## Line Chart: MathVista Accuracy vs. Number of Solutions per Problem
### Overview
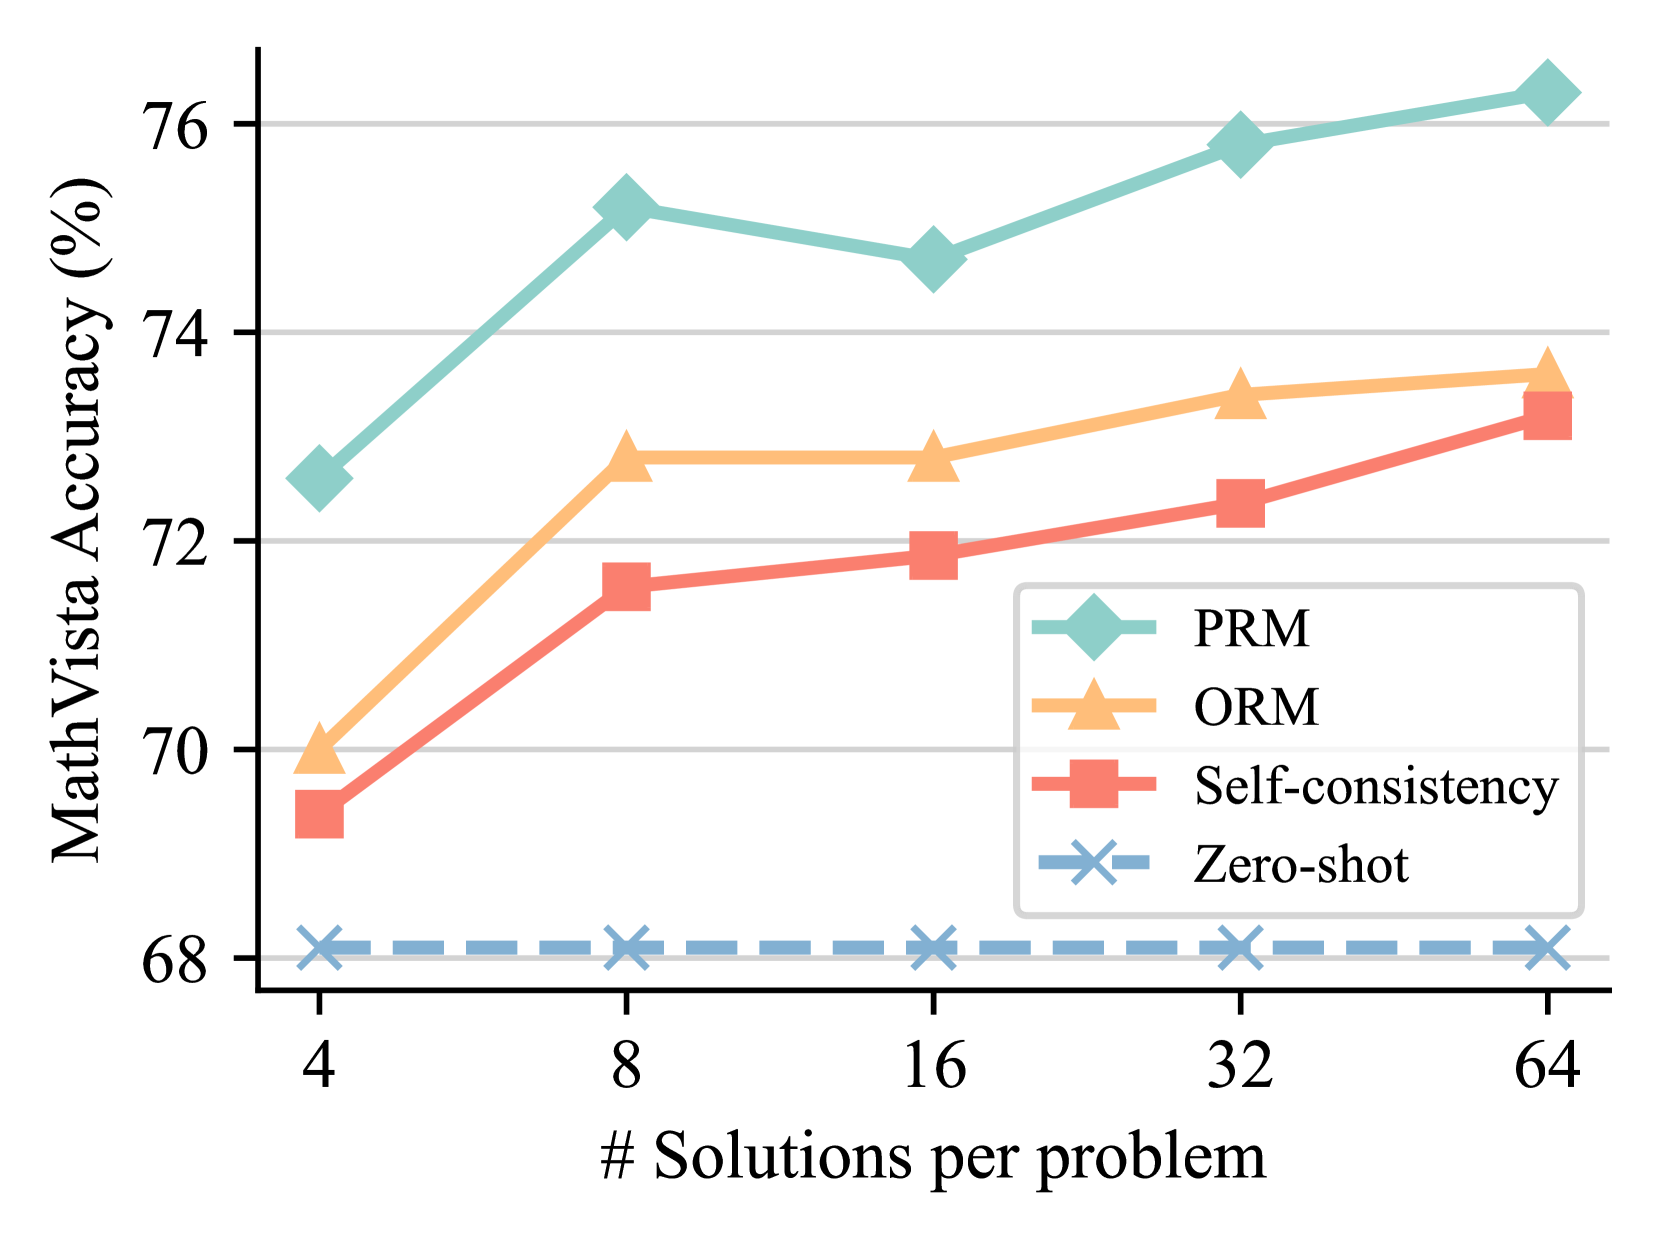
The image is a line chart comparing the MathVista accuracy (%) of four different methods (PRM, ORM, Self-consistency, and Zero-shot) against the number of solutions per problem. The x-axis represents the number of solutions per problem, ranging from 4 to 64. The y-axis represents the MathVista accuracy in percentage, ranging from 68% to 76%.
### Components/Axes
* **X-axis:** "# Solutions per problem" with markers at 4, 8, 16, 32, and 64.
* **Y-axis:** "MathVista Accuracy (%)" with markers at 68, 70, 72, 74, and 76.
* **Legend:** Located in the center-right of the chart, it identifies the four methods:
* PRM (light teal line with diamond markers)
* ORM (light orange line with triangle markers)
* Self-consistency (light red line with square markers)
* Zero-shot (light blue dashed line with 'x' markers)
### Detailed Analysis
* **PRM (light teal line with diamond markers):** The line starts at approximately 72.5% accuracy with 4 solutions, increases to approximately 75.2% at 8 solutions, decreases slightly to approximately 74.8% at 16 solutions, and then increases to approximately 75.8% at 32 solutions, and finally reaches approximately 76.2% at 64 solutions.
* **ORM (light orange line with triangle markers):** The line starts at approximately 69.8% accuracy with 4 solutions, increases to approximately 72.8% at 8 solutions, remains relatively stable at approximately 72.8% at 16 solutions, increases to approximately 73.4% at 32 solutions, and reaches approximately 73.8% at 64 solutions.
* **Self-consistency (light red line with square markers):** The line starts at approximately 69.3% accuracy with 4 solutions, increases to approximately 71.5% at 8 solutions, increases to approximately 71.9% at 16 solutions, increases to approximately 72.2% at 32 solutions, and reaches approximately 73.2% at 64 solutions.
* **Zero-shot (light blue dashed line with 'x' markers):** The line remains relatively constant at approximately 68.1% accuracy across all numbers of solutions per problem.
### Key Observations
* PRM consistently outperforms the other methods, achieving the highest accuracy across all numbers of solutions per problem.
* Zero-shot has the lowest accuracy and remains constant regardless of the number of solutions.
* ORM and Self-consistency show similar trends, with accuracy increasing as the number of solutions increases.
### Interpretation
The chart demonstrates the impact of the number of solutions per problem on the MathVista accuracy of different methods. PRM appears to be the most effective method, while Zero-shot is the least effective. The increasing accuracy of ORM and Self-consistency with more solutions suggests that these methods benefit from having more data to work with. The relatively flat performance of Zero-shot indicates that it is not influenced by the number of solutions provided.