\n
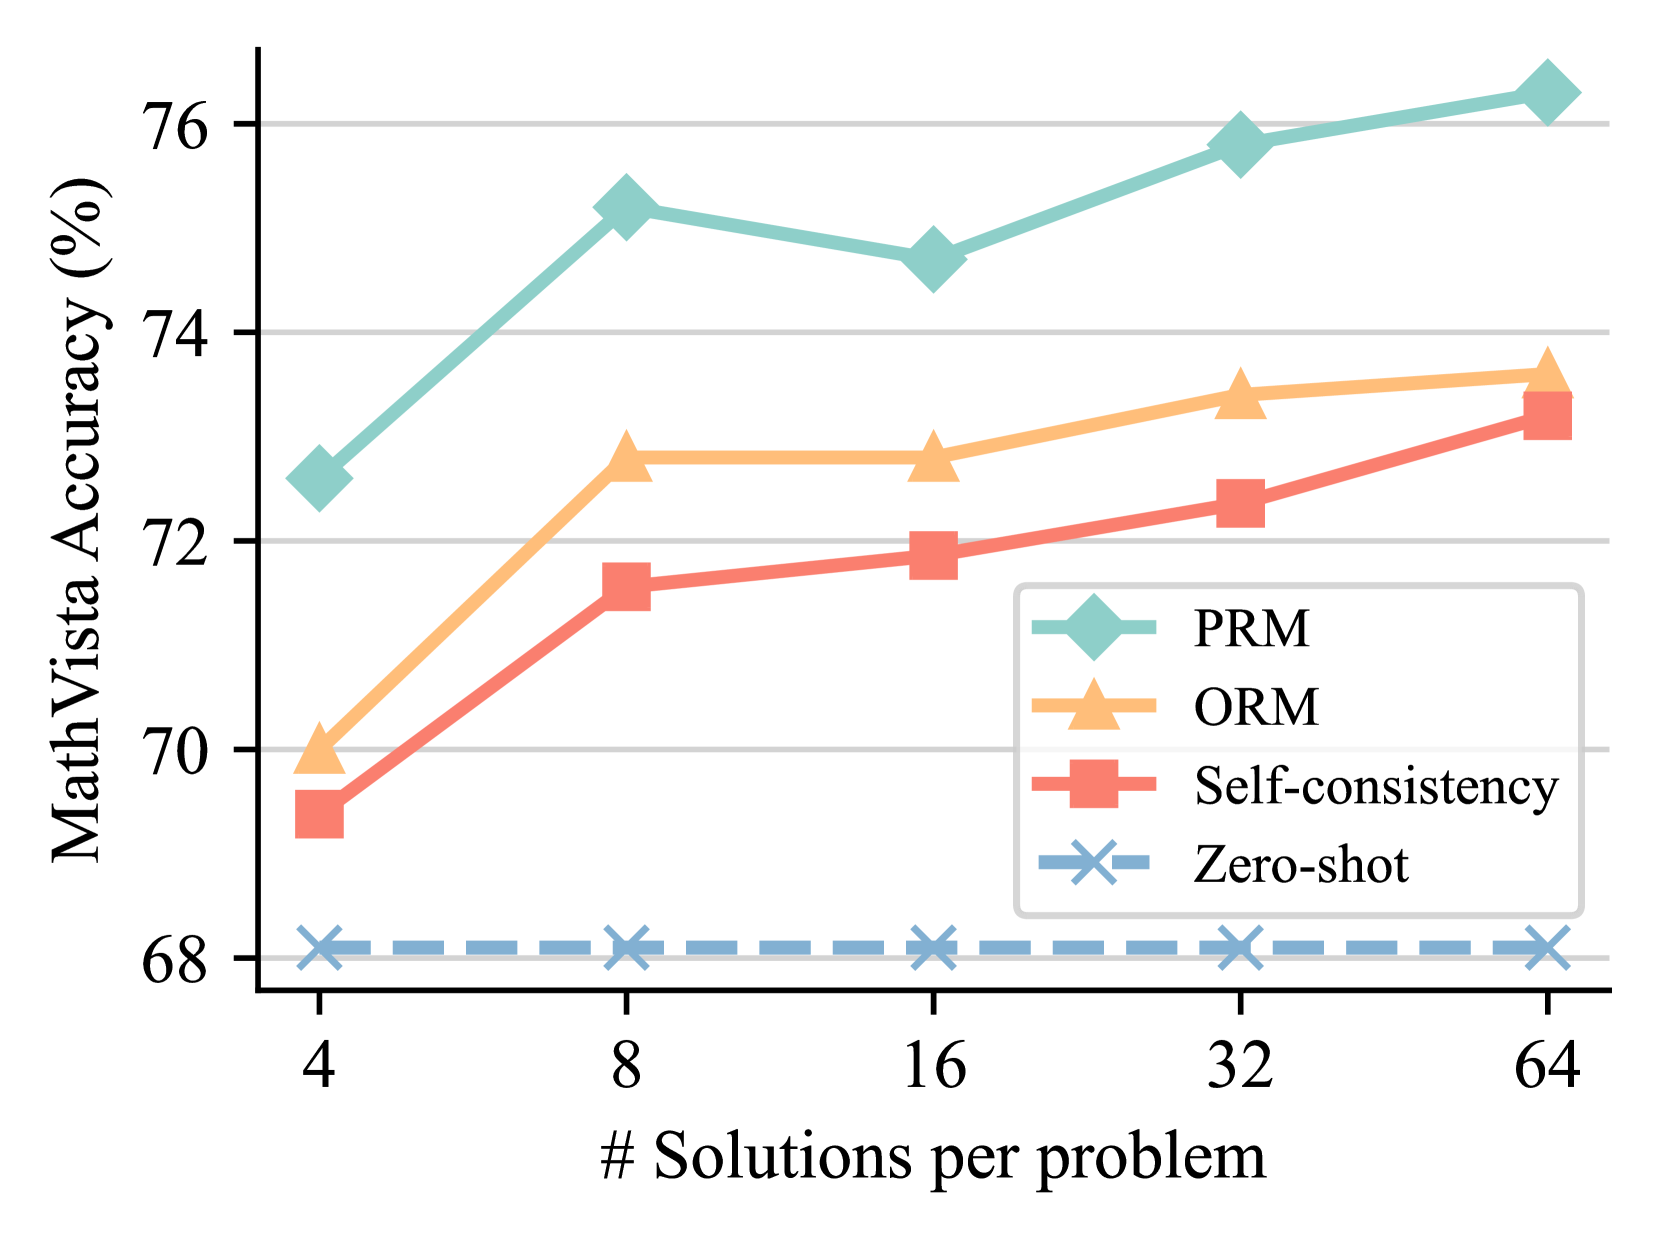
## Line Chart: MathVista Accuracy vs. Solutions per Problem
### Overview
This line chart depicts the relationship between the number of solutions generated per problem and the resulting MathVista accuracy for four different methods: PRM, ORM, Self-consistency, and Zero-shot. The x-axis represents the number of solutions per problem, ranging from 4 to 64. The y-axis represents the MathVista accuracy, expressed as a percentage, ranging from 68% to 76%.
### Components/Axes
* **X-axis Title:** "# Solutions per problem"
* **Y-axis Title:** "MathVista Accuracy (%)"
* **X-axis Markers:** 4, 8, 16, 32, 64
* **Y-axis Markers:** 68, 70, 72, 74, 76
* **Legend:** Located in the top-right corner of the chart.
* PRM (represented by a light teal line with a triangular marker)
* ORM (represented by a light orange line with a triangular marker)
* Self-consistency (represented by a light red line with a square marker)
* Zero-shot (represented by a light purple line with a cross marker)
### Detailed Analysis
* **PRM:** The PRM line slopes upward, indicating increasing accuracy with more solutions.
* At 4 solutions: Approximately 73% accuracy.
* At 8 solutions: Approximately 75% accuracy.
* At 16 solutions: Approximately 75% accuracy.
* At 32 solutions: Approximately 76% accuracy.
* At 64 solutions: Approximately 76% accuracy.
* **ORM:** The ORM line also slopes upward, but less steeply than PRM.
* At 4 solutions: Approximately 69.5% accuracy.
* At 8 solutions: Approximately 72.5% accuracy.
* At 16 solutions: Approximately 72.5% accuracy.
* At 32 solutions: Approximately 73% accuracy.
* At 64 solutions: Approximately 73.5% accuracy.
* **Self-consistency:** The Self-consistency line shows an initial increase, then plateaus.
* At 4 solutions: Approximately 69% accuracy.
* At 8 solutions: Approximately 71.5% accuracy.
* At 16 solutions: Approximately 71.5% accuracy.
* At 32 solutions: Approximately 72.5% accuracy.
* At 64 solutions: Approximately 73.5% accuracy.
* **Zero-shot:** The Zero-shot line is nearly flat, indicating minimal change in accuracy with more solutions.
* At 4 solutions: Approximately 68.5% accuracy.
* At 8 solutions: Approximately 68.5% accuracy.
* At 16 solutions: Approximately 68.5% accuracy.
* At 32 solutions: Approximately 68.5% accuracy.
* At 64 solutions: Approximately 68.5% accuracy.
### Key Observations
* PRM consistently achieves the highest accuracy across all solution counts.
* The Zero-shot method exhibits the lowest and most stable accuracy.
* The benefits of increasing solutions diminish for PRM after 32 solutions.
* ORM and Self-consistency show similar performance, with Self-consistency slightly outperforming ORM at higher solution counts.
### Interpretation
The data suggests that increasing the number of solutions generated per problem generally improves MathVista accuracy, but the extent of improvement varies significantly depending on the method used. PRM appears to be the most effective method, benefiting substantially from more solutions, while Zero-shot shows little to no improvement. The plateauing of PRM's accuracy after 32 solutions suggests a point of diminishing returns. The relatively stable performance of Zero-shot indicates that it may be limited by its inherent approach and unable to leverage additional solutions effectively. The comparison between ORM and Self-consistency suggests that self-consistency may be a slightly more robust approach, particularly as the number of solutions increases. This data could be used to optimize the solution generation process for MathVista, potentially focusing on PRM and limiting the number of solutions generated beyond a certain threshold to maximize efficiency.