## Bar Chart: Model Calibration Performance Comparison
### Overview
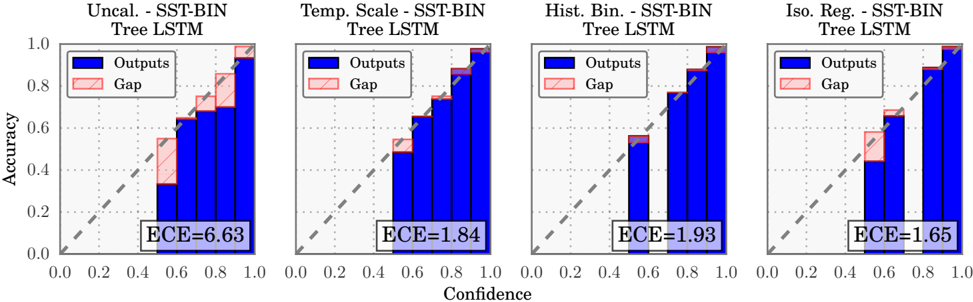
The image contains four grouped bar charts comparing calibration performance metrics (accuracy, confidence, Expected Calibration Error) across four model configurations: Uncalibrated, Temperature Scaling, Histogram Binning, and Isotonic Regression. Each chart uses a dual-color bar system (blue for "Outputs", pink for "Gap") to visualize the relationship between confidence intervals and accuracy.
### Components/Axes
- **X-axis**: Confidence (0.0 to 1.0 in 0.2 increments)
- **Y-axis**: Accuracy (0.0 to 1.0 in 0.2 increments)
- **Legend**:
- Blue = Outputs (model confidence)
- Pink = Gap (difference between confidence and accuracy)
- **Subplots**:
1. Uncal. - SST-BIN Tree LSTM
2. Temp. Scale - SST-BIN Tree LSTM
3. Hist. Bin. - SST-BIN Tree LSTM
4. Iso. Reg. - SST-BIN Tree LSTM
- **Annotations**:
- Diagonal dashed line (perfect calibration reference)
- ECE values in bottom-left corner of each subplot
### Detailed Analysis
1. **Uncal. - SST-BIN Tree LSTM**
- ECE = 6.63 (highest error)
- Blue bars show increasing accuracy with confidence
- Pink gaps decrease slightly with higher confidence intervals
- Largest discrepancy between confidence and accuracy at 0.0-0.2 confidence range
2. **Temp. Scale - SST-BIN Tree LSTM**
- ECE = 1.84
- Blue bars show steeper accuracy increase
- Pink gaps remain relatively consistent across confidence intervals
- Better alignment between confidence and accuracy than Uncal. model
3. **Hist. Bin. - SST-BIN Tree LSTM**
- ECE = 1.93
- Blue bars show moderate accuracy growth
- Pink gaps decrease significantly at higher confidence intervals
- Largest calibration error at 0.0-0.2 confidence range
4. **Iso. Reg. - SST-BIN Tree LSTM**
- ECE = 1.65 (lowest error)
- Blue bars show gradual accuracy increase
- Pink gaps decrease proportionally with confidence
- Most consistent calibration across all confidence intervals
### Key Observations
- All models show increasing accuracy with higher confidence intervals
- Calibration error (ECE) decreases significantly from Uncalibrated (6.63) to Isotonic Regression (1.65)
- Isotonic Regression demonstrates the smallest gap between confidence and accuracy across all intervals
- Histogram Binning shows the most dramatic reduction in calibration gap at higher confidence levels
- Temperature Scaling maintains relatively consistent calibration gaps across confidence intervals
### Interpretation
The data demonstrates that model calibration significantly impacts performance reliability. Isotonic Regression achieves the best calibration (lowest ECE=1.65), indicating its confidence predictions most accurately reflect true accuracy. The Uncalibrated model's high ECE (6.63) suggests severe overconfidence in low-confidence predictions. The consistent decrease in calibration gaps across confidence intervals in all models suggests that higher confidence predictions are generally more reliable, but calibration techniques (particularly Isotonic Regression) are critical for maintaining this relationship across the full confidence spectrum. The pink "Gap" bars visually quantify the calibration error magnitude at each confidence level, with smaller gaps indicating better model reliability.