# Technical Document Extraction: Line Charts for Datasets A, B, and C
## Chart Structure
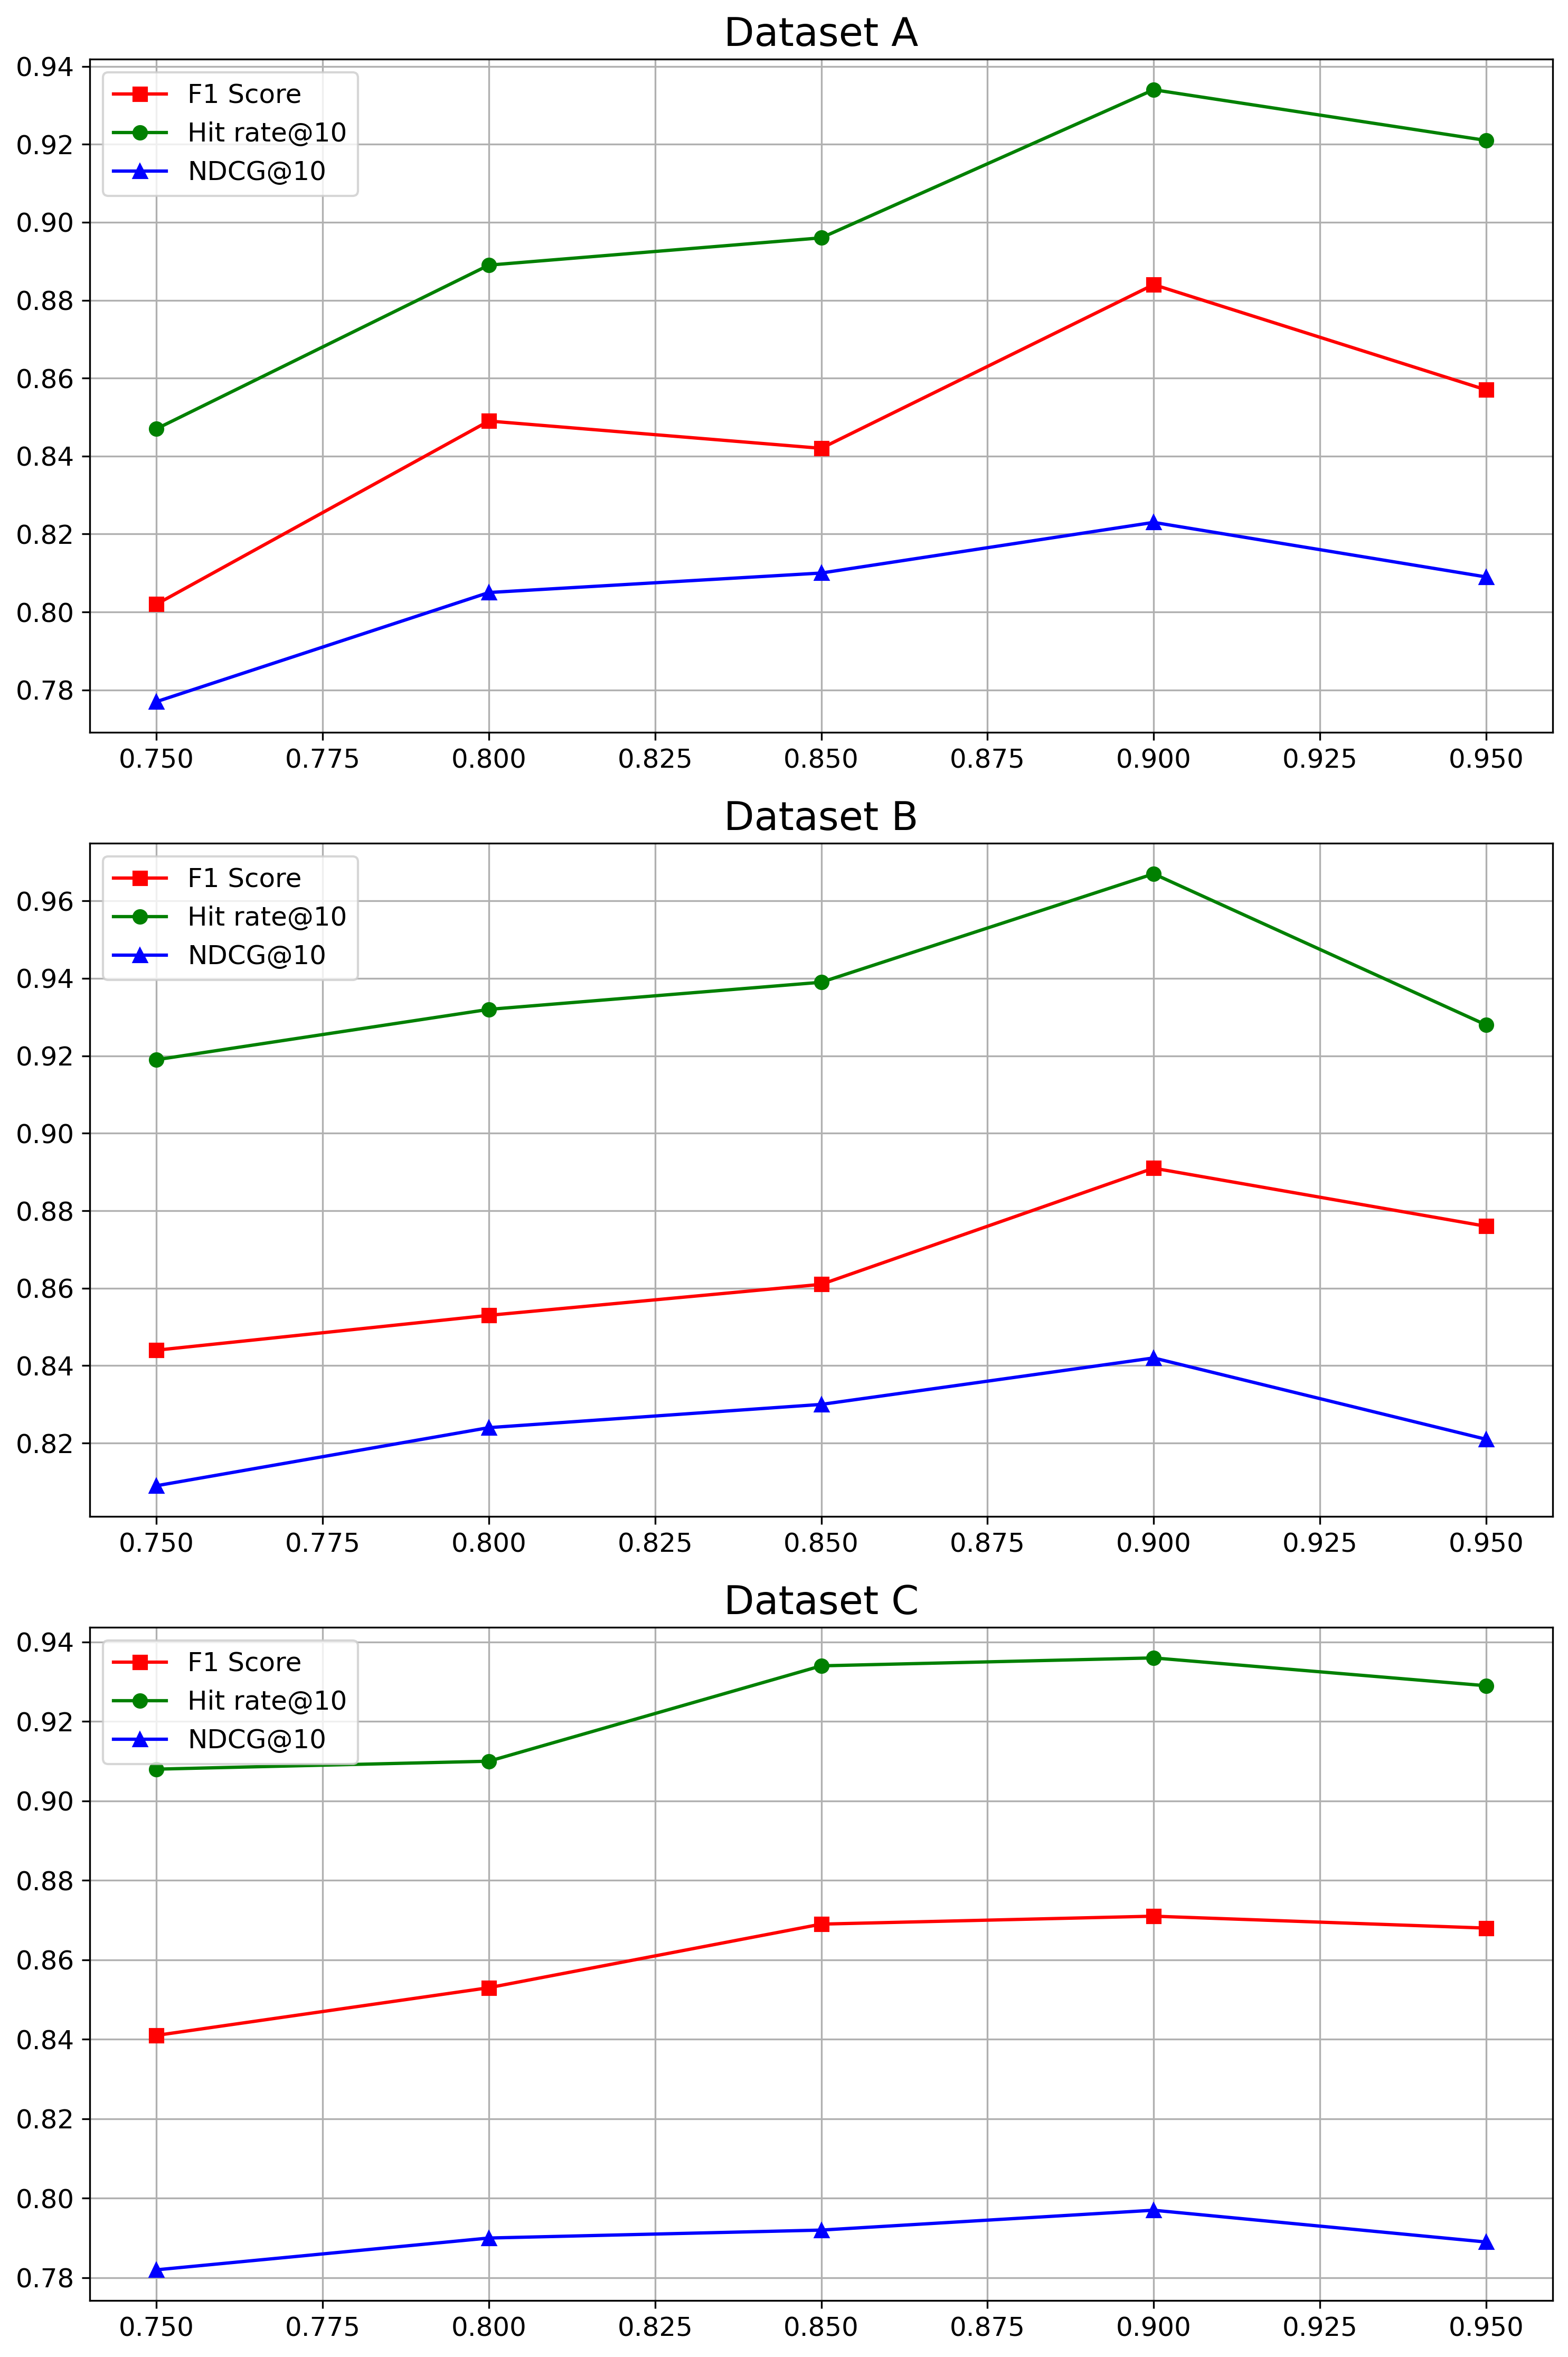
Three line charts are presented, each representing performance metrics across a parameter range (x-axis) for three datasets (A, B, C). Each chart includes:
- **X-axis**: Parameter values (0.75 to 0.95 in increments of 0.025)
- **Y-axis**: Metric values (0.75 to 0.94 in increments of 0.02)
- **Legend**: Three metrics with distinct markers/colors:
- **F1 Score**: Red squares
- **Hit rate@10**: Green circles
- **NDCG@10**: Blue triangles
---
## Dataset A
### Key Trends
1. **Hit rate@10** (green circles):
- Steadily increases from ~0.845 (x=0.75) to ~0.935 (x=0.90)
- Slight decline to ~0.93 (x=0.95)
2. **F1 Score** (red squares):
- Rises from ~0.80 (x=0.75) to peak at ~0.885 (x=0.90)
- Declines to ~0.865 (x=0.95)
3. **NDCG@10** (blue triangles):
- Gradual increase from ~0.775 (x=0.75) to ~0.83 (x=0.90)
- Minor drop to ~0.81 (x=0.95)
---
## Dataset B
### Key Trends
1. **Hit rate@10** (green circles):
- Consistent upward trend from ~0.92 (x=0.75) to ~0.96 (x=0.90)
- Declines to ~0.93 (x=0.95)
2. **F1 Score** (red squares):
- Gradual rise from ~0.84 (x=0.75) to peak at ~0.89 (x=0.90)
- Slight decrease to ~0.87 (x=0.95)
3. **NDCG@10** (blue triangles):
- Slow increase from ~0.79 (x=0.75) to ~0.84 (x=0.90)
- Minor drop to ~0.81 (x=0.95)
---
## Dataset C
### Key Trends
1. **Hit rate@10** (green circles):
- Stable at ~0.91 (x=0.75–0.90)
- Slight decline to ~0.92 (x=0.95)
2. **F1 Score** (red squares):
- Gradual increase from ~0.84 (x=0.75) to peak at ~0.87 (x=0.90)
- Minor drop to ~0.865 (x=0.95)
3. **NDCG@10** (blue triangles):
- Flat trend (~0.78–0.80) across all x-values
---
## Axis Details
- **X-axis Labels**: 0.75, 0.775, 0.80, 0.825, 0.85, 0.875, 0.90, 0.925, 0.95
- **Y-axis Labels**: 0.75, 0.78, 0.80, 0.82, 0.84, 0.86, 0.88, 0.90, 0.92, 0.94
- **Legend Consistency**:
- Red squares (F1 Score) align with red lines in all charts.
- Green circles (Hit rate@10) align with green lines.
- Blue triangles (NDCG@10) align with blue lines.
---
## Observations
- **Dataset A**: Highest variability in metrics, with Hit rate@10 showing the steepest growth.
- **Dataset B**: Highest overall performance, particularly in Hit rate@10 and F1 Score.
- **Dataset C**: Most stable metrics, with minimal fluctuations across the parameter range.