## Hierarchical Diagram: Box Distribution and Transformation
### Overview
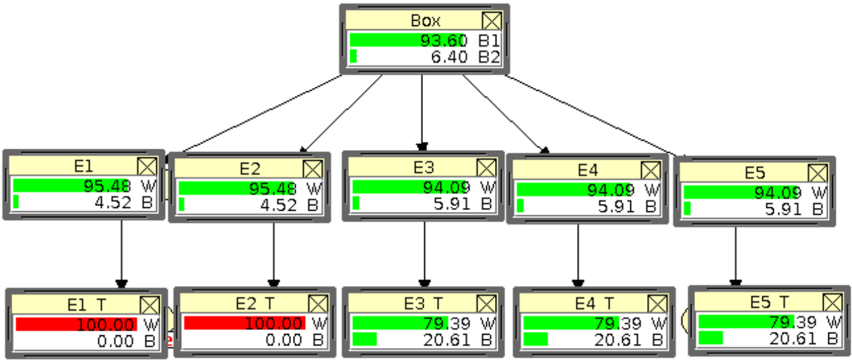
The image depicts a hierarchical structure with a central "Box" at the top, connected to five intermediate boxes (E1–E5) via arrows. Each intermediate box is further connected to a terminal box (E1T–E5T) below it. The diagram uses color-coded bars (green and red) to represent two metrics: "W" (green) and "B" (red), as indicated by the legend. Numerical values are provided for each metric in the boxes.
### Components/Axes
- **Main Box (Top Center)**:
- Label: "Box"
- Values:
- 93.60 W (green bar)
- 6.40 B (red bar)
- Legend:
- Green = "W"
- Red = "B"
- Positioned in the top-right corner of the main box.
- **Intermediate Boxes (E1–E5)**:
- Each labeled "E1" to "E5" with corresponding values:
- **E1**: 95.48 W, 4.52 B
- **E2**: 95.48 W, 4.52 B
- **E3**: 94.09 W, 5.91 B
- **E4**: 94.09 W, 5.91 B
- **E5**: 94.09 W, 5.91 B
- Arrows connect the main box to each E box.
- **Terminal Boxes (E1T–E5T)**:
- Each labeled "E1T" to "E5T" with values:
- **E1T**: 100.00 W, 0.00 B
- **E2T**: 100.00 W, 0.00 B
- **E3T**: 79.39 W, 20.61 B
- **E4T**: 79.39 W, 20.61 B
- **E5T**: 79.39 W, 20.61 B
- Arrows connect each E box to its corresponding T box.
### Detailed Analysis
- **Main Box**:
- Dominates the top of the diagram, acting as the source of values.
- 93.60 W (green) and 6.40 B (red) suggest a primary distribution of "W" with a smaller "B" component.
- **Intermediate Boxes (E1–E5)**:
- **E1 and E2** mirror the main box's "W" value (95.48) but with slightly lower "B" (4.52 vs. 6.40).
- **E3–E5** show a higher "B" value (5.91) compared to the main box, with "W" slightly reduced (94.09).
- All E boxes maintain a 100% total (W + B = 100), indicating normalized values.
- **Terminal Boxes (E1T–E5T)**:
- **E1T and E2T** have 100% W (100.00 W, 0.00 B), suggesting a complete transformation or retention of "W" in these paths.
- **E3T–E5T** show a split: 79.39 W and 20.61 B, indicating partial retention of "W" and introduction of "B".
### Key Observations
1. **Consistency in E1–E2**: Both E1 and E2 retain the same "W" and "B" values, implying identical processing or distribution rules.
2. **Divergence in E3–E5**: These boxes show a higher "B" proportion than the main box, suggesting a downstream transformation or loss of "W".
3. **Terminal Boxes**:
- E1T and E2T achieve 100% W, possibly indicating a threshold or ideal state.
- E3T–E5T show a 20.61 B value, which may represent a failure rate, error margin, or secondary output.
### Interpretation
The diagram likely models a process where the "Box" distributes resources or values (W and B) to intermediate stages (E1–E5), which then pass them to terminal stages (E1T–E5T). The color coding (green for W, red for B) suggests two distinct metrics or categories.
- **E1 and E2** maintain high "W" values, possibly representing efficient or primary pathways.
- **E3–E5** introduce more "B", which could indicate inefficiencies, errors, or secondary outputs.
- The terminal boxes (E1T–E5T) show a clear split: E1T and E2T achieve 100% W, while E3T–E5T retain only 79.39% W, suggesting a degradation or transformation of the original "W" value.
This structure might represent a system where initial inputs (Box) are processed through stages (E1–E5) with varying outcomes, culminating in terminal states (E1T–E5T) that reflect the efficiency or fidelity of the process. The use of percentages implies normalization, ensuring all values sum to 100% within each box.