## Diagram: Bayesian Network
### Overview
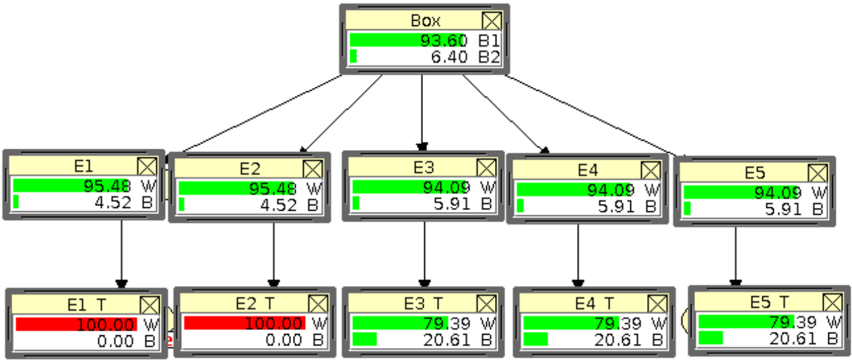
The image depicts a Bayesian network diagram. It shows probabilistic relationships between a "Box" node at the top and several "E" nodes in two layers below. The nodes are labeled with probabilities associated with different states, denoted by "W" and "B" or "B1" and "B2". The arrows indicate the direction of influence or dependency.
### Components/Axes
* **Nodes:** Rectangular boxes representing variables or events.
* "Box" at the top.
* "E1", "E2", "E3", "E4", "E5" in the middle layer.
* "E1 T", "E2 T", "E3 T", "E4 T", "E5 T" in the bottom layer.
* **Edges:** Arrows connecting the nodes, indicating probabilistic dependencies.
* **Probabilities:** Numerical values within each node, representing the probability of different states.
* "W" and "B" likely stand for "Working" and "Broken" or similar states.
* "B1" and "B2" are states for the "Box" node.
* **Color Coding:**
* Green likely indicates a higher probability.
* Red likely indicates a lower probability.
### Detailed Analysis
**Top Node: Box**
* Label: "Box"
* B1: 93.60 (Green bar is large)
* B2: 6.40 (Green bar is small)
**Middle Layer Nodes:**
* **E1:**
* Label: "E1"
* W: 95.48 (Green bar is large)
* B: 4.52 (Green bar is small)
* **E2:**
* Label: "E2"
* W: 95.48 (Green bar is large)
* B: 4.52 (Green bar is small)
* **E3:**
* Label: "E3"
* W: 94.09 (Green bar is large)
* B: 5.91 (Green bar is small)
* **E4:**
* Label: "E4"
* W: 94.09 (Green bar is large)
* B: 5.91 (Green bar is small)
* **E5:**
* Label: "E5"
* W: 94.09 (Green bar is large)
* B: 5.91 (Green bar is small)
**Bottom Layer Nodes:**
* **E1 T:**
* Label: "E1 T"
* W: 100.00 (Red bar is large)
* B: 0.00 (Red bar is small)
* **E2 T:**
* Label: "E2 T"
* W: 100.00 (Red bar is large)
* B: 0.00 (Red bar is small)
* **E3 T:**
* Label: "E3 T"
* W: 79.39 (Green bar is large)
* B: 20.61 (Green bar is small)
* **E4 T:**
* Label: "E4 T"
* W: 79.39 (Green bar is large)
* B: 20.61 (Green bar is small)
* **E5 T:**
* Label: "E5 T"
* W: 79.39 (Green bar is large)
* B: 20.61 (Green bar is small)
### Key Observations
* The "Box" node has a high probability of being in state "B1" (93.60) compared to "B2" (6.40).
* The "E1" and "E2" nodes in the middle layer have identical probabilities for states "W" and "B" (95.48 and 4.52, respectively).
* The "E3", "E4", and "E5" nodes in the middle layer also have identical probabilities for states "W" and "B" (94.09 and 5.91, respectively).
* The "E1 T" and "E2 T" nodes in the bottom layer have a 100% probability for state "W" and 0% for state "B".
* The "E3 T", "E4 T", and "E5 T" nodes in the bottom layer have identical probabilities for states "W" and "B" (79.39 and 20.61, respectively).
### Interpretation
The Bayesian network models the probabilistic dependencies between the "Box" and the "E" nodes. The probabilities suggest that the "Box" is likely in state "B1". The middle layer "E" nodes have a high probability of being in state "W". The bottom layer "E T" nodes show a divergence: "E1 T" and "E2 T" are almost certainly in state "W", while "E3 T", "E4 T", and "E5 T" have a lower probability of being in state "W". This could indicate that "E1 T" and "E2 T" are more reliable or have different influencing factors compared to "E3 T", "E4 T", and "E5 T". The network could be used to infer the state of the "Box" given the states of the "E T" nodes, or vice versa. The color-coding reinforces the probability values, making it easy to visually assess the likelihood of each state.