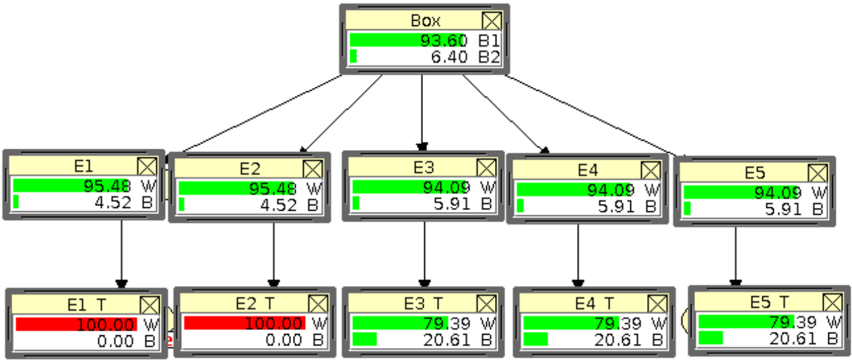
## Diagram: Hierarchical Data Representation
### Overview
The image depicts a hierarchical diagram representing data flow or distribution across multiple levels. A central "Box" node branches out into five "E1" through "E5" nodes, which further branch into "E1 T" through "E5 T" nodes. Each node displays numerical values labeled "W" and "B", along with a visual indicator (color bar) representing a percentage. Arrows indicate the direction of the hierarchy.
### Components/Axes
The diagram consists of three levels:
1. **Root Node:** "Box"
2. **Intermediate Nodes:** "E1", "E2", "E3", "E4", "E5"
3. **Leaf Nodes:** "E1 T", "E2 T", "E3 T", "E4 T", "E5 T"
Each node contains the following elements:
* A node label (e.g., "Box", "E1", "E1 T").
* Two numerical values, labeled "W" and "B".
* A small visual indicator (color bar) representing a percentage.
* A small "X" symbol in the top-right corner.
Arrows connect the nodes, indicating the hierarchical relationship.
### Detailed Analysis or Content Details
**Root Node ("Box"):**
* Value W: 93.60
* Value B: 6.40
**Intermediate Nodes (E1-E5):**
* **E1:**
* Value W: 95.48
* Value B: 4.52
* **E2:**
* Value W: 95.48
* Value B: 4.52
* **E3:**
* Value W: 94.09
* Value B: 5.91
* **E4:**
* Value W: 94.09
* Value B: 5.91
* **E5:**
* Value W: 94.09
* Value B: 5.91
**Leaf Nodes (E1 T - E5 T):**
* **E1 T:**
* Value W: 100.00
* Value B: 0.00
* **E2 T:**
* Value W: 100.00
* Value B: 0.00
* **E3 T:**
* Value W: 79.39
* Value B: 20.61
* **E4 T:**
* Value W: 79.39
* Value B: 20.61
* **E5 T:**
* Value W: 79.39
* Value B: 20.61
The color bars within each node visually represent the proportion of "W" versus "B". Green indicates a higher proportion of "W", while red indicates a higher proportion of "B".
### Key Observations
* The "Box" node has a relatively balanced distribution of "W" and "B" (93.60 vs 6.40).
* The intermediate nodes (E1-E5) all have a high proportion of "W" (around 94-95%), with a small proportion of "B" (around 4-6%).
* The leaf nodes show a divergence. E1 and E2 have 100% "W" and 0% "B", while E3, E4, and E5 have a significantly lower proportion of "W" (around 79%) and a higher proportion of "B" (around 21%).
* E3, E4, and E5 have identical values for both "W" and "B".
### Interpretation
This diagram likely represents a process where a resource (represented by "W") is distributed or allocated. The "Box" node could represent the total available resource. The intermediate nodes (E1-E5) represent different branches or categories within the distribution. The leaf nodes (E1 T - E5 T) represent the final allocation or outcome within each branch.
The data suggests that the resource is initially distributed relatively evenly across the branches (E1-E5). However, in branches E3, E4, and E5, a significant portion of the resource is converted or allocated to "B". The complete allocation to "W" in E1 and E2 suggests a different outcome or process in those branches.
The consistent values in E3, E4, and E5 suggest a common factor influencing the allocation to "B" in those branches. The diagram could be used to identify bottlenecks or areas where the resource is not being utilized effectively (e.g., the high proportion of "B" in E3-E5). The "X" symbols in the top-right corner of each node might indicate a status or flag associated with that node.