## Heatmap: Classification Accuracies
### Overview
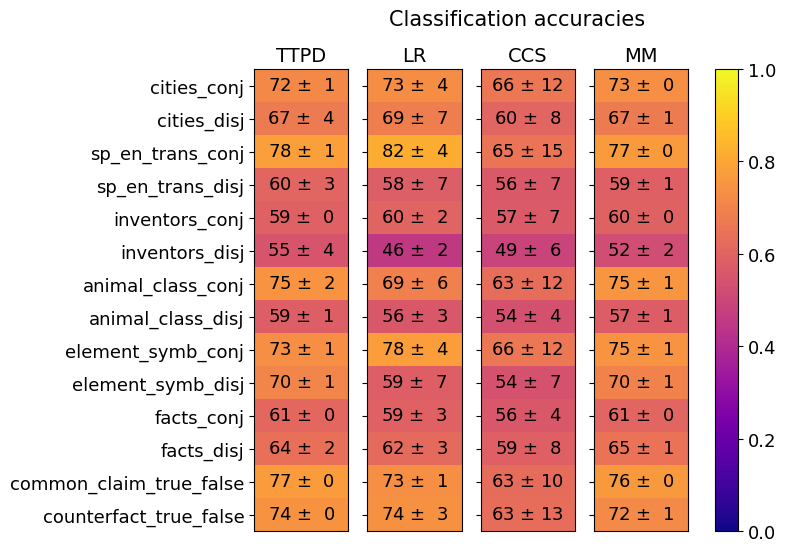
The image is a heatmap displaying classification accuracies for different models (TTPD, LR, CCS, MM) across various categories. The color intensity represents the accuracy score, ranging from dark blue (low accuracy) to bright yellow (high accuracy). Each cell contains the accuracy value and its standard deviation.
### Components/Axes
* **Title:** Classification accuracies
* **Columns (Models):** TTPD, LR, CCS, MM
* **Rows (Categories):**
* cities\_conj
* cities\_disj
* sp\_en\_trans\_conj
* sp\_en\_trans\_disj
* inventors\_conj
* inventors\_disj
* animal\_class\_conj
* animal\_class\_disj
* element\_symb\_conj
* element\_symb\_disj
* facts\_conj
* facts\_disj
* common\_claim\_true\_false
* counterfact\_true\_false
* **Color Scale:** Ranges from 0.0 (dark blue) to 1.0 (bright yellow), representing the classification accuracy. The scale is positioned on the right side of the heatmap.
### Detailed Analysis or ### Content Details
Here's a breakdown of the accuracy values for each model and category:
* **TTPD:**
* cities\_conj: 72 ± 1
* cities\_disj: 67 ± 4
* sp\_en\_trans\_conj: 78 ± 1
* sp\_en\_trans\_disj: 60 ± 3
* inventors\_conj: 59 ± 0
* inventors\_disj: 55 ± 4
* animal\_class\_conj: 75 ± 2
* animal\_class\_disj: 59 ± 1
* element\_symb\_conj: 73 ± 1
* element\_symb\_disj: 70 ± 1
* facts\_conj: 61 ± 0
* facts\_disj: 64 ± 2
* common\_claim\_true\_false: 77 ± 0
* counterfact\_true\_false: 74 ± 0
* **LR:**
* cities\_conj: 73 ± 4
* cities\_disj: 69 ± 7
* sp\_en\_trans\_conj: 82 ± 4
* sp\_en\_trans\_disj: 58 ± 7
* inventors\_conj: 60 ± 2
* inventors\_disj: 46 ± 2
* animal\_class\_conj: 69 ± 6
* animal\_class\_disj: 56 ± 3
* element\_symb\_conj: 78 ± 4
* element\_symb\_disj: 59 ± 7
* facts\_conj: 59 ± 3
* facts\_disj: 62 ± 3
* common\_claim\_true\_false: 73 ± 1
* counterfact\_true\_false: 74 ± 3
* **CCS:**
* cities\_conj: 66 ± 12
* cities\_disj: 60 ± 8
* sp\_en\_trans\_conj: 65 ± 15
* sp\_en\_trans\_disj: 56 ± 7
* inventors\_conj: 57 ± 7
* inventors\_disj: 49 ± 6
* animal\_class\_conj: 63 ± 12
* animal\_class\_disj: 54 ± 4
* element\_symb\_conj: 66 ± 12
* element\_symb\_disj: 54 ± 7
* facts\_conj: 56 ± 4
* facts\_disj: 59 ± 8
* common\_claim\_true\_false: 63 ± 10
* counterfact\_true\_false: 63 ± 13
* **MM:**
* cities\_conj: 73 ± 0
* cities\_disj: 67 ± 1
* sp\_en\_trans\_conj: 77 ± 0
* sp\_en\_trans\_disj: 59 ± 1
* inventors\_conj: 60 ± 0
* inventors\_disj: 52 ± 2
* animal\_class\_conj: 75 ± 1
* animal\_class\_disj: 57 ± 1
* element\_symb\_conj: 75 ± 1
* element\_symb\_disj: 70 ± 1
* facts\_conj: 61 ± 0
* facts\_disj: 65 ± 1
* common\_claim\_true\_false: 76 ± 0
* counterfact\_true\_false: 72 ± 1
### Key Observations
* LR model achieves the highest accuracy for 'sp\_en\_trans\_conj' (82 ± 4).
* CCS model generally has lower accuracies compared to other models, with higher standard deviations.
* 'inventors\_disj' consistently shows lower accuracy across all models, especially for LR (46 ± 2).
* MM model has zero standard deviation for several categories, suggesting consistent performance.
* The 'common\_claim\_true\_false' category shows relatively high accuracy across all models.
### Interpretation
The heatmap provides a comparative view of the classification accuracies of four different models across a range of categories. The color-coding allows for quick identification of high and low performance areas.
The LR model appears to perform well on 'sp\_en\_trans\_conj', but struggles with 'inventors\_disj'. The CCS model exhibits lower overall accuracy and higher variability, suggesting it may be less reliable for these tasks. The MM model shows consistent performance with zero standard deviation in several categories, indicating stable and predictable results.
The 'inventors\_disj' category seems to be particularly challenging for all models, suggesting inherent difficulties in classifying this type of data. Conversely, 'common\_claim\_true\_false' is relatively easy to classify, as indicated by the high accuracy scores across all models.
The data suggests that the choice of model can significantly impact classification accuracy, and the optimal model may vary depending on the specific category being classified. Further investigation into the characteristics of each category and the strengths and weaknesses of each model could provide insights into improving classification performance.