## Heatmap: Classification Accuracies
### Overview
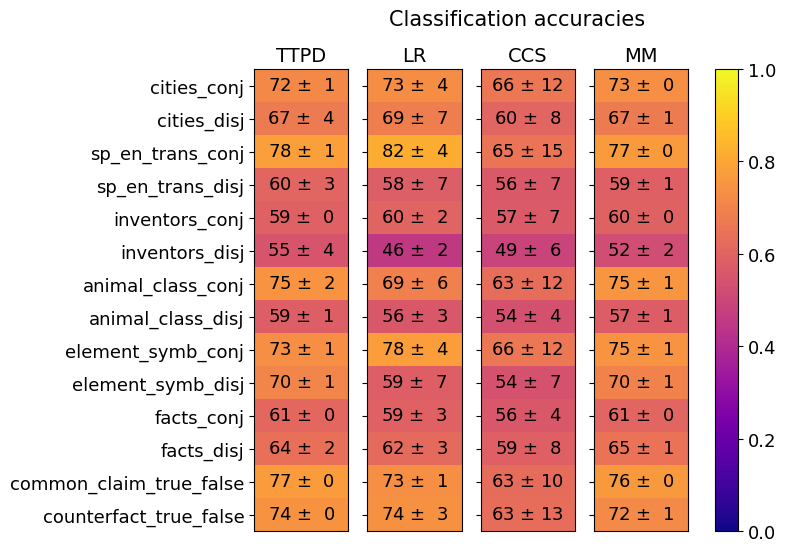
This image presents a heatmap displaying classification accuracies for various datasets and methods. The heatmap visualizes the performance of four different methods (TTPD, LR, CCS, MM) across ten different datasets, each presented in two variations: 'conj' (conjunctive) and 'disj' (disjunctive). Accuracy values are color-coded, with higher accuracies represented by yellow and lower accuracies by blue. Each value is presented with a ± uncertainty.
### Components/Axes
* **Y-axis (Rows):** Represents the datasets. The datasets are:
* cities\_conj
* cities\_disj
* sp\_en\_trans\_conj
* sp\_en\_trans\_disj
* inventors\_conj
* inventors\_disj
* animal\_class\_conj
* animal\_class\_disj
* element\_symb\_conj
* element\_symb\_disj
* facts\_conj
* facts\_disj
* common\_claim\_true\_false
* counterfact\_true\_false
* **X-axis (Columns):** Represents the classification methods:
* TTPD
* LR
* CCS
* MM
* **Color Scale (Right):** Represents the classification accuracy, ranging from 0.0 (blue) to 1.0 (yellow).
* **Title:** "Classification accuracies" (positioned at the top-center)
### Detailed Analysis
The heatmap displays accuracy values with associated uncertainties. I will analyze each method's performance across the datasets, noting trends and specific values.
**TTPD (First Column):**
* cities\_conj: 72 ± 1
* cities\_disj: 67 ± 4
* sp\_en\_trans\_conj: 78 ± 1
* sp\_en\_trans\_disj: 60 ± 3
* inventors\_conj: 59 ± 0
* inventors\_disj: 55 ± 4
* animal\_class\_conj: 75 ± 2
* animal\_class\_disj: 59 ± 1
* element\_symb\_conj: 73 ± 1
* element\_symb\_disj: 70 ± 1
* facts\_conj: 61 ± 0
* facts\_disj: 64 ± 2
* common\_claim\_true\_false: 77 ± 0
* counterfact\_true\_false: 74 ± 0
**LR (Second Column):**
* cities\_conj: 73 ± 4
* cities\_disj: 69 ± 7
* sp\_en\_trans\_conj: 82 ± 4
* sp\_en\_trans\_disj: 58 ± 7
* inventors\_conj: 60 ± 2
* inventors\_disj: 46 ± 2
* animal\_class\_conj: 69 ± 6
* animal\_class\_disj: 56 ± 3
* element\_symb\_conj: 78 ± 4
* element\_symb\_disj: 59 ± 7
* facts\_conj: 59 ± 3
* facts\_disj: 62 ± 3
* common\_claim\_true\_false: 73 ± 1
* counterfact\_true\_false: 74 ± 3
**CCS (Third Column):**
* cities\_conj: 66 ± 12
* cities\_disj: 60 ± 8
* sp\_en\_trans\_conj: 65 ± 15
* sp\_en\_trans\_disj: 56 ± 7
* inventors\_conj: 57 ± 7
* inventors\_disj: 49 ± 6
* animal\_class\_conj: 63 ± 12
* animal\_class\_disj: 54 ± 4
* element\_symb\_conj: 66 ± 12
* element\_symb\_disj: 54 ± 7
* facts\_conj: 56 ± 4
* facts\_disj: 59 ± 8
* common\_claim\_true\_false: 63 ± 10
* counterfact\_true\_false: 63 ± 13
**MM (Fourth Column):**
* cities\_conj: 73 ± 0
* cities\_disj: 67 ± 1
* sp\_en\_trans\_conj: 77 ± 0
* sp\_en\_trans\_disj: 59 ± 1
* inventors\_conj: 60 ± 0
* inventors\_disj: 52 ± 2
* animal\_class\_conj: 75 ± 1
* animal\_class\_disj: 57 ± 1
* element\_symb\_conj: 75 ± 1
* element\_symb\_disj: 70 ± 1
* facts\_conj: 61 ± 0
* facts\_disj: 65 ± 1
* common\_claim\_true\_false: 76 ± 0
* counterfact\_true\_false: 72 ± 1
### Key Observations
* **High Performance:** The 'sp\_en\_trans\_conj' dataset consistently shows high accuracy across all methods, often exceeding 0.75.
* **Low Performance:** The 'inventors\_disj' dataset generally exhibits lower accuracy, particularly for LR and CCS.
* **Method Comparison:** LR and MM tend to perform similarly, often achieving the highest accuracies. TTPD and CCS show more variability.
* **Conj vs. Disj:** For many datasets, the 'conj' version yields higher accuracy than the 'disj' version.
* **Uncertainty:** The uncertainties are relatively small (generally ±1 to ±4), suggesting reliable estimates of accuracy. CCS has the largest uncertainties.
### Interpretation
The heatmap demonstrates the performance of different classification methods on a variety of datasets. The consistent high accuracy on 'sp\_en\_trans\_conj' suggests this dataset is particularly well-suited for these methods. The lower accuracy on 'inventors\_disj' indicates this dataset presents a greater challenge, potentially due to its inherent complexity or the specific characteristics of the disjunctive form.
The comparison between LR and MM suggests they are robust and effective methods for this type of classification task. The lower performance of CCS, coupled with its larger uncertainties, may indicate it is less reliable or requires further tuning.
The general trend of higher accuracy for 'conj' versions compared to 'disj' versions suggests that the conjunctive form of these datasets is easier to classify than the disjunctive form. This could be due to the simpler logical structure of conjunctive statements.
The heatmap provides a valuable overview of the strengths and weaknesses of each method and dataset, allowing for informed decisions about which methods to use for specific tasks. The small uncertainties suggest the results are statistically meaningful.