TECHNICAL ASSET FINGERPRINT
d8ab5afc38a5186980ccf6b4
Click to view fullscreen
Press ESC or click to close
FOUND IN PAPERS
EXPERT: healer-alpha-free VERSION 1
RUNTIME: free/openrouter/healer-alpha
INTEL_VERIFIED
## Heatmap: Classification Accuracies
### Overview
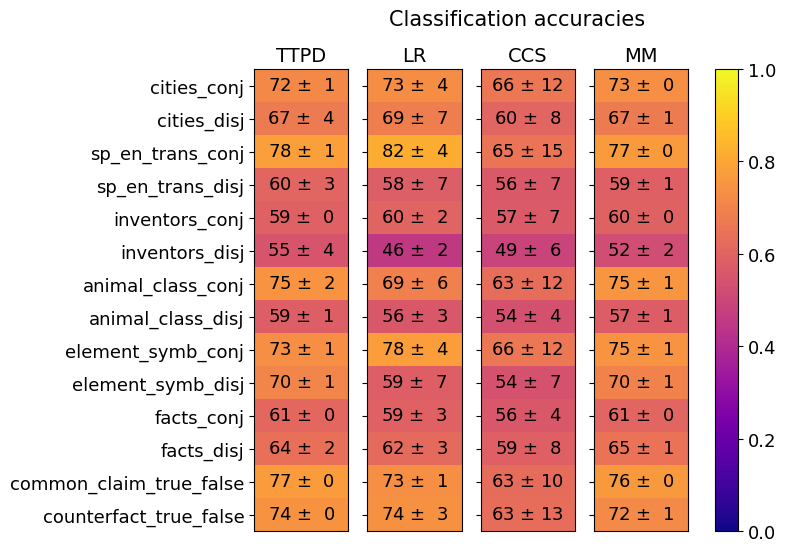
The image is a heatmap titled "Classification accuracies." It visually compares the performance (accuracy) of four different models or methods across 14 distinct classification tasks. Performance is represented by color intensity, with a corresponding numerical value (mean accuracy ± standard deviation) displayed in each cell.
### Components/Axes
* **Title:** "Classification accuracies" (centered at the top).
* **Column Headers (Models/Methods):** Four columns, labeled from left to right:
1. `TTPD`
2. `LR`
3. `CCS`
4. `MM`
* **Row Labels (Tasks):** Fourteen rows, labeled from top to bottom:
1. `cities_conj`
2. `cities_disj`
3. `sp_en_trans_conj`
4. `sp_en_trans_disj`
5. `inventors_conj`
6. `inventors_disj`
7. `animal_class_conj`
8. `animal_class_disj`
9. `element_symb_conj`
10. `element_symb_disj`
11. `facts_conj`
12. `facts_disj`
13. `common_claim_true_false`
14. `counterfact_true_false`
* **Color Scale/Legend:** A vertical color bar is positioned on the right side of the heatmap.
* **Scale:** Ranges from `0.0` (bottom, dark purple/blue) to `1.0` (top, bright yellow).
* **Gradient:** The color transitions from dark purple/blue (low accuracy) through red/orange to yellow (high accuracy).
* **Cell Content:** Each cell contains a text string in the format `XX ± Y`, where `XX` is the mean accuracy percentage and `Y` is the standard deviation.
### Detailed Analysis
Below is the extracted data for each task (row) across the four models (columns). Values are percentages.
| Task | TTPD (Accuracy ± Std Dev) | LR (Accuracy ± Std Dev) | CCS (Accuracy ± Std Dev) | MM (Accuracy ± Std Dev) |
| :--- | :--- | :--- | :--- | :--- |
| **cities_conj** | 72 ± 1 | 73 ± 4 | 66 ± 12 | 73 ± 0 |
| **cities_disj** | 67 ± 4 | 69 ± 7 | 60 ± 8 | 67 ± 1 |
| **sp_en_trans_conj** | 78 ± 1 | 82 ± 4 | 65 ± 15 | 77 ± 0 |
| **sp_en_trans_disj** | 60 ± 3 | 58 ± 7 | 56 ± 7 | 59 ± 1 |
| **inventors_conj** | 59 ± 0 | 60 ± 2 | 57 ± 7 | 60 ± 0 |
| **inventors_disj** | 55 ± 4 | 46 ± 2 | 49 ± 6 | 52 ± 2 |
| **animal_class_conj** | 75 ± 2 | 69 ± 6 | 63 ± 12 | 75 ± 1 |
| **animal_class_disj** | 59 ± 1 | 56 ± 3 | 54 ± 4 | 57 ± 1 |
| **element_symb_conj** | 73 ± 1 | 78 ± 4 | 66 ± 12 | 75 ± 1 |
| **element_symb_disj** | 70 ± 1 | 59 ± 7 | 54 ± 7 | 70 ± 1 |
| **facts_conj** | 61 ± 0 | 59 ± 3 | 56 ± 4 | 61 ± 0 |
| **facts_disj** | 64 ± 2 | 62 ± 3 | 59 ± 8 | 65 ± 1 |
| **common_claim_true_false** | 77 ± 0 | 73 ± 1 | 63 ± 10 | 76 ± 0 |
| **counterfact_true_false** | 74 ± 0 | 74 ± 3 | 63 ± 13 | 72 ± 1 |
**Visual Trend & Color Verification:**
* **High Accuracy (Yellow/Orange):** The brightest cells (highest accuracy) are found in the `sp_en_trans_conj` row for the `LR` model (82 ± 4) and several `conj` tasks for `TTPD` and `MM`.
* **Low Accuracy (Purple/Red):** The darkest cells (lowest accuracy) are in the `inventors_disj` row, particularly for the `LR` model (46 ± 2) and `CCS` model (49 ± 6).
* **Model Consistency:** The `TTPD` and `MM` models show very low standard deviations (often 0 or 1), indicating highly consistent performance across runs. The `CCS` model frequently shows the highest standard deviations (e.g., ±12, ±15), indicating more variable performance.
* **Task Pattern:** For most tasks, the `_conj` (conjunction) variant has a higher accuracy than its `_disj` (disjunction) counterpart. This is visually apparent as the `_conj` rows are generally brighter in color.
### Key Observations
1. **Top Performer:** The `LR` model achieves the single highest accuracy on the chart (82 ± 4 on `sp_en_trans_conj`). However, its performance is inconsistent, dropping to the lowest overall score on `inventors_disj`.
2. **Most Consistent Models:** `TTPD` and `MM` demonstrate remarkable stability, with standard deviations frequently at 0 or 1. Their performance is often very similar to each other.
3. **Most Variable Model:** `CCS` has the widest spread of standard deviations, suggesting its performance is less reliable or more sensitive to experimental conditions.
4. **Easiest Tasks:** The `_conj` tasks, especially `sp_en_trans_conj`, `cities_conj`, and `common_claim_true_false`, yield the highest accuracies across most models.
5. **Hardest Tasks:** The `inventors_disj` task is the most challenging, with all models scoring below 55%. The `sp_en_trans_disj` and `animal_class_disj` tasks are also notably difficult.
6. **Performance Gap:** A significant gap often exists between the best and worst-performing models on a given task. For example, on `element_symb_disj`, `TTPD` and `MM` score 70, while `LR` scores 59 and `CCS` scores 54.
### Interpretation
This heatmap provides a comparative analysis of model robustness across a suite of logical and factual classification tasks. The data suggests several key insights:
* **Task Difficulty:** The consistent drop in accuracy from `_conj` to `_disj` tasks indicates that disjunctive reasoning (evaluating "A or B") is systematically harder for these models than conjunctive reasoning (evaluating "A and B"). This is a significant finding about the models' logical capabilities.
* **Model Specialization vs. Generalization:** No single model dominates all tasks. `LR` shows peak performance on specific tasks but is brittle on others. `TTPD` and `MM` appear to be more general-purpose, reliable models, trading off top-end accuracy for consistency. `CCS` appears to be the least robust overall.
* **Reliability Indicator:** The standard deviation values are crucial. A model like `TTPD` with `72 ± 1` is more trustworthy in a practical setting than a model like `CCS` with `66 ± 12`, even if their mean scores were closer, because its output is more predictable.
* **Underlying Challenge:** The poor performance on tasks like `inventors_disj` and `facts_disj` may point to a fundamental limitation in the models' ability to handle negation, uncertainty, or complex relational data, which are often components of disjunctive statements.
In summary, the chart is not just a performance leaderboard but a diagnostic tool. It reveals that the choice of model should be dictated by the specific type of task (conjunctive vs. disjunctive) and the need for consistency versus peak accuracy. The clear `_conj`/`_disj` performance split is the most critical pattern, offering a direct avenue for future model improvement.
DECODING INTELLIGENCE...