## Heatmap: Classification accuracies
### Overview
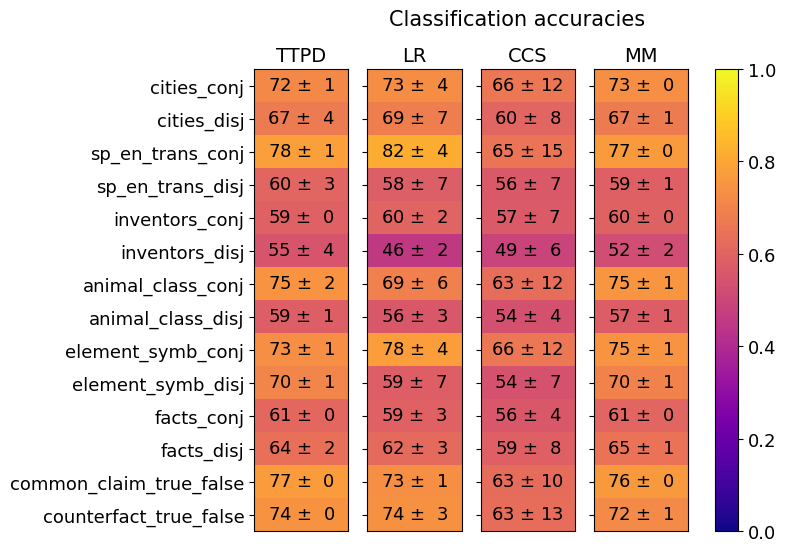
The image is a heatmap comparing classification accuracies across 14 linguistic categories and 4 methods (TTPD, LR, CCS, MM). Values are represented by color intensity (purple=low, yellow=high) with numerical values and standard deviations (±) embedded in each cell. The legend on the right maps colors to accuracy scores (0.0–1.0).
### Components/Axes
- **Y-axis (Categories)**: 14 linguistic categories (e.g., `cities_conj`, `sp_en_trans_disj`, `inventors_disj`).
- **X-axis (Methods)**: 4 classification methods (`TTPD`, `LR`, `CCS`, `MM`).
- **Legend**: Color gradient from purple (0.0) to yellow (1.0), with numerical midpoint values (e.g., 0.2, 0.4, 0.6, 0.8).
- **Title**: "Classification accuracies" at the top center.
### Detailed Analysis
#### Categories and Method Performance
1. **`cities_conj`**:
- TTPD: 72 ± 1 (orange)
- LR: 73 ± 4 (orange)
- CCS: 66 ± 12 (light orange)
- MM: 73 ± 0 (orange)
2. **`cities_disj`**:
- TTPD: 67 ± 4 (orange)
- LR: 69 ± 7 (orange)
- CCS: 60 ± 8 (light orange)
- MM: 67 ± 1 (orange)
3. **`sp_en_trans_conj`**:
- TTPD: 78 ± 1 (yellow)
- LR: 82 ± 4 (bright yellow)
- CCS: 65 ± 15 (light orange)
- MM: 77 ± 0 (yellow)
4. **`sp_en_trans_disj`**:
- TTPD: 60 ± 3 (orange)
- LR: 58 ± 7 (orange)
- CCS: 56 ± 7 (light orange)
- MM: 59 ± 1 (orange)
5. **`inventors_conj`**:
- TTPD: 59 ± 0 (orange)
- LR: 60 ± 2 (orange)
- CCS: 57 ± 7 (light orange)
- MM: 60 ± 0 (orange)
6. **`inventors_disj`**:
- TTPD: 55 ± 4 (orange)
- LR: 46 ± 2 (purple)
- CCS: 49 ± 6 (light purple)
- MM: 52 ± 2 (orange)
7. **`animal_class_conj`**:
- TTPD: 75 ± 2 (yellow)
- LR: 69 ± 6 (orange)
- CCS: 63 ± 12 (light orange)
- MM: 75 ± 1 (yellow)
8. **`animal_class_disj`**:
- TTPD: 59 ± 1 (orange)
- LR: 56 ± 3 (orange)
- CCS: 54 ± 4 (light orange)
- MM: 57 ± 1 (orange)
9. **`element_symb_conj`**:
- TTPD: 73 ± 1 (orange)
- LR: 78 ± 4 (yellow)
- CCS: 66 ± 12 (light orange)
- MM: 75 ± 1 (yellow)
10. **`element_symb_disj`**:
- TTPD: 70 ± 1 (orange)
- LR: 59 ± 7 (orange)
- CCS: 54 ± 7 (light orange)
- MM: 70 ± 1 (orange)
11. **`facts_conj`**:
- TTPD: 61 ± 0 (orange)
- LR: 59 ± 3 (orange)
- CCS: 56 ± 4 (light orange)
- MM: 61 ± 0 (orange)
12. **`facts_disj`**:
- TTPD: 64 ± 2 (orange)
- LR: 62 ± 3 (orange)
- CCS: 59 ± 8 (light orange)
- MM: 65 ± 1 (orange)
13. **`common_claim_true_false`**:
- TTPD: 77 ± 0 (yellow)
- LR: 73 ± 1 (orange)
- CCS: 63 ± 10 (light orange)
- MM: 76 ± 0 (yellow)
14. **`counterfact_true_false`**:
- TTPD: 74 ± 0 (yellow)
- LR: 74 ± 3 (orange)
- CCS: 63 ± 13 (light orange)
- MM: 72 ± 1 (orange)
### Key Observations
1. **Highest Accuracy**:
- `sp_en_trans_conj` under **LR** (82 ± 4, bright yellow).
- `common_claim_true_false` under **TTPD** (77 ± 0, yellow).
2. **Lowest Accuracy**:
- `inventors_disj` under **LR** (46 ± 2, purple).
3. **Standard Deviation Trends**:
- **CCS** consistently has the highest variability (e.g., 12–15 in `cities_conj`, `element_symb_conj`).
- **MM** shows the lowest variability (e.g., ±0 in `cities_conj`, `common_claim_true_false`).
4. **Method Consistency**:
- **MM** performs most consistently across categories (smallest standard deviations).
- **LR** has the highest peak accuracy but also the lowest trough (inventors_disj).
### Interpretation
The heatmap reveals that **LR** achieves the highest accuracy in specific categories (e.g., `sp_en_trans_conj`) but struggles in others (e.g., `inventors_disj`), suggesting it excels in certain linguistic patterns but lacks robustness. **MM** demonstrates the most consistent performance across all categories, with minimal variability (±0–1 in many cases), making it a reliable choice for general use. **TTPD** and **CCS** show moderate performance with higher variability, indicating potential sensitivity to category-specific features. The data underscores the importance of method selection based on the target linguistic category and the trade-off between peak accuracy and consistency.