## Line Chart: ΔP vs. Layer for Llama Models
### Overview
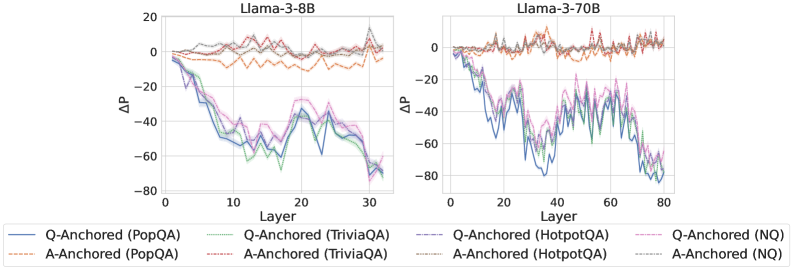
The image presents two line charts comparing the change in probability (ΔP) across layers for two Llama models: Llama-3-8B and Llama-3-70B. The charts display ΔP as a function of layer number, with different lines representing different question-answering datasets and anchoring methods.
### Components/Axes
* **X-axis:** Layer (ranging from approximately 0 to 30 for Llama-3-8B and 0 to 80 for Llama-3-70B).
* **Y-axis:** ΔP (ranging from approximately -80 to 20).
* **Models:** Llama-3-8B (left chart), Llama-3-70B (right chart).
* **Datasets/Anchoring:**
* Q-Anchored (PopQA) - Blue solid line
* A-Anchored (PopQA) - Orange dashed line
* Q-Anchored (TriviaQA) - Purple solid line
* A-Anchored (TriviaQA) - Light-orange dashed line
* Q-Anchored (HotpotQA) - Brown dashed-dotted line
* A-Anchored (HotpotQA) - Green dashed line
* Q-Anchored (NQ) - Teal solid line
* A-Anchored (NQ) - Pink dashed line
* **Legend:** Located at the bottom of the image, clearly labeling each line with its corresponding dataset and anchoring method.
### Detailed Analysis or Content Details
**Llama-3-8B (Left Chart):**
* **Q-Anchored (PopQA):** The blue line starts at approximately 5, decreases sharply to around -40 by layer 10, then continues to decrease to approximately -60 by layer 30.
* **A-Anchored (PopQA):** The orange dashed line starts at approximately 5, remains relatively stable around 0 to 5 until layer 15, then decreases to approximately -30 by layer 30.
* **Q-Anchored (TriviaQA):** The purple line starts at approximately 0, decreases to around -30 by layer 10, and then fluctuates between -30 and -50 until layer 30.
* **A-Anchored (TriviaQA):** The light-orange dashed line starts at approximately 0, decreases to around -20 by layer 10, and then fluctuates between -20 and -40 until layer 30.
* **Q-Anchored (HotpotQA):** The brown dashed-dotted line starts at approximately 5, decreases to around -20 by layer 10, and then fluctuates between -20 and -40 until layer 30.
* **A-Anchored (HotpotQA):** The green dashed line starts at approximately 5, decreases to around -10 by layer 10, and then fluctuates between -10 and -30 until layer 30.
* **Q-Anchored (NQ):** The teal line starts at approximately 5, decreases to around -20 by layer 10, and then fluctuates between -20 and -40 until layer 30.
* **A-Anchored (NQ):** The pink dashed line starts at approximately 5, decreases to around -10 by layer 10, and then fluctuates between -10 and -30 until layer 30.
**Llama-3-70B (Right Chart):**
* **Q-Anchored (PopQA):** The blue line starts at approximately 5, decreases sharply to around -40 by layer 20, then continues to decrease to approximately -60 by layer 60, and finally reaches around -70 by layer 80.
* **A-Anchored (PopQA):** The orange dashed line starts at approximately 5, remains relatively stable around 0 to 5 until layer 20, then decreases to approximately -30 by layer 80.
* **Q-Anchored (TriviaQA):** The purple line starts at approximately 0, decreases to around -20 by layer 20, and then fluctuates between -20 and -50 until layer 80.
* **A-Anchored (TriviaQA):** The light-orange dashed line starts at approximately 0, decreases to around -10 by layer 20, and then fluctuates between -10 and -30 until layer 80.
* **Q-Anchored (HotpotQA):** The brown dashed-dotted line starts at approximately 5, decreases to around -10 by layer 20, and then fluctuates between -10 and -30 until layer 80.
* **A-Anchored (HotpotQA):** The green dashed line starts at approximately 5, decreases to around -5 by layer 20, and then fluctuates between -5 and -20 until layer 80.
* **Q-Anchored (NQ):** The teal line starts at approximately 5, decreases to around -10 by layer 20, and then fluctuates between -10 and -30 until layer 80.
* **A-Anchored (NQ):** The pink dashed line starts at approximately 5, decreases to around -5 by layer 20, and then fluctuates between -5 and -20 until layer 80.
### Key Observations
* For both models, the Q-Anchored (PopQA) line consistently exhibits the most significant decrease in ΔP across layers.
* A-Anchored lines generally remain closer to 0 compared to Q-Anchored lines, indicating a smaller change in probability.
* The Llama-3-70B model shows a more prolonged decrease in ΔP across a larger number of layers compared to the Llama-3-8B model.
* The lines for different datasets and anchoring methods tend to converge at higher layer numbers, suggesting a similar behavior in the deeper layers of the models.
### Interpretation
The charts demonstrate how the change in probability (ΔP) varies across layers for different question-answering datasets and anchoring methods in Llama models. The steeper decline in ΔP for Q-Anchored (PopQA) suggests that this combination is more sensitive to changes in layers, potentially indicating a stronger reliance on specific layer features for answering questions from the PopQA dataset. The relatively stable ΔP for A-Anchored lines suggests a more robust and consistent performance across layers. The larger number of layers in the Llama-3-70B model allows for a more gradual and prolonged decrease in ΔP, potentially indicating a more complex and nuanced representation of information. The convergence of lines at higher layers suggests that the models may rely on similar features in the deeper layers, regardless of the dataset or anchoring method. These findings could be valuable for understanding the internal workings of Llama models and optimizing their performance for specific tasks.