\n
## Line Charts: Llama-3 Model Layer-wise ΔP Analysis
### Overview
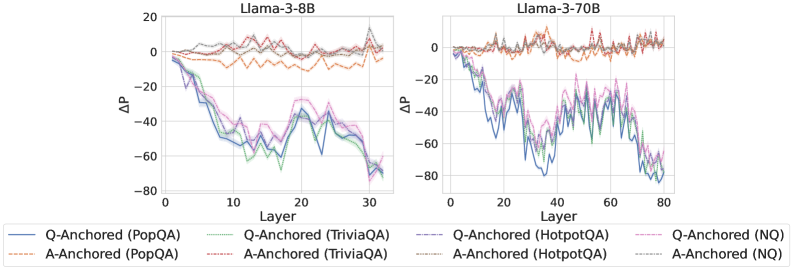
The image displays two side-by-side line charts comparing the layer-wise change in probability (ΔP) for two different Large Language Models (LLMs): Llama-3-8B (left chart) and Llama-3-70B (right chart). Each chart plots ΔP against the model's layer number for multiple question-answering (QA) datasets, using two different prompting strategies: "Q-Anchored" and "A-Anchored".
### Components/Axes
* **Chart Titles:**
* Left Chart: `Llama-3-8B`
* Right Chart: `Llama-3-70B`
* **Y-Axis (Both Charts):** Label is `ΔP`. The scale ranges from -80 to 20, with major gridlines at intervals of 20 (-80, -60, -40, -20, 0, 20).
* **X-Axis (Both Charts):** Label is `Layer`.
* For Llama-3-8B: Scale ranges from 0 to 30, with major ticks at 0, 10, 20, 30.
* For Llama-3-70B: Scale ranges from 0 to 80, with major ticks at 0, 20, 40, 60, 80.
* **Legend (Bottom, spanning both charts):** Contains 8 entries, differentiating lines by color and style (solid vs. dashed).
* **Q-Anchored (Solid Lines):**
* Blue: `Q-Anchored (PopQA)`
* Green: `Q-Anchored (TriviaQA)`
* Purple: `Q-Anchored (HotpotQA)`
* Pink: `Q-Anchored (NQ)`
* **A-Anchored (Dashed Lines):**
* Orange: `A-Anchored (PopQA)`
* Red: `A-Anchored (TriviaQA)`
* Brown: `A-Anchored (HotpotQA)`
* Gray: `A-Anchored (NQ)`
### Detailed Analysis
**Llama-3-8B Chart (Left):**
* **Q-Anchored Series (Solid Lines):** All four datasets (PopQA, TriviaQA, HotpotQA, NQ) show a strong, consistent downward trend. They start near ΔP = 0 at Layer 0 and decline to approximately ΔP = -70 by Layer 30. The lines are tightly clustered, with the blue (PopQA) and green (TriviaQA) lines often slightly lower than the purple (HotpotQA) and pink (NQ) lines in the middle layers (10-20).
* **A-Anchored Series (Dashed Lines):** All four datasets show a relatively flat, stable trend, fluctuating near ΔP = 0 across all layers. They exhibit minor noise but no significant upward or downward slope. The orange (PopQA) and red (TriviaQA) lines appear to have slightly more variance than the brown (HotpotQA) and gray (NQ) lines.
**Llama-3-70B Chart (Right):**
* **Q-Anchored Series (Solid Lines):** Similar to the 8B model, all four datasets show a pronounced downward trend. They start near ΔP = 0 at Layer 0 and decline to approximately ΔP = -70 to -80 by Layer 80. The trend is more volatile (noisier) than in the 8B model, with significant dips and recoveries, particularly between layers 20 and 60. The lines remain closely grouped.
* **A-Anchored Series (Dashed Lines):** Consistent with the 8B model, all four datasets remain stable, fluctuating around ΔP = 0 across the entire layer range (0-80). The noise level appears slightly higher than in the 8B chart.
### Key Observations
1. **Strategy Dichotomy:** There is a stark and consistent contrast between the two prompting strategies across both model sizes. Q-Anchored prompting leads to a dramatic, layer-dependent decrease in ΔP, while A-Anchored prompting results in a stable ΔP near zero.
2. **Model Size Effect:** The general pattern is preserved from the 8B to the 70B model. The primary difference is the extended x-axis (more layers) and increased volatility in the Q-Anchored lines for the larger model.
3. **Dataset Similarity:** Within each prompting strategy (Q-Anchored or A-Anchored), the behavior across the four different QA datasets (PopQA, TriviaQA, HotpotQA, NQ) is remarkably similar. The lines for different datasets follow nearly identical trajectories.
4. **Spatial Grounding:** The legend is positioned at the bottom center of the entire figure. In both charts, the Q-Anchored (solid) lines occupy the lower portion of the graph (negative ΔP), while the A-Anchored (dashed) lines occupy the upper portion (near-zero ΔP).
### Interpretation
This data suggests a fundamental difference in how information is processed or retained across model layers depending on the prompt anchoring strategy.
* **Q-Anchored (Question-Anchored) Prompting:** The consistent, steep decline in ΔP indicates that as information propagates through the network's layers, the model's probability assignment (likely to the correct answer or a specific token) diminishes significantly. This could imply that the question context becomes less influential or is "forgotten" in deeper layers, or that the model's internal representations shift away from the initial question framing. The increased noise in the larger 70B model might reflect more complex internal dynamics.
* **A-Anchored (Answer-Anchored) Prompting:** The stable ΔP near zero suggests that when the answer is provided in the prompt, the model's probability assignment remains consistent across layers. This indicates a form of stability or reinforcement; the presence of the answer anchor may create a consistent signal that persists through the network's depth.
**Conclusion:** The choice between question-anchored and answer-anchored prompting is not merely a surface-level formatting choice but appears to fundamentally alter the layer-wise dynamics of probability assignment within Llama-3 models. The A-Anchored strategy promotes stability, while the Q-Anchored strategy leads to a progressive attenuation of the initial signal. This has significant implications for understanding model behavior, designing prompts for specific tasks (e.g., retrieval-augmented generation vs. closed-book QA), and potentially for model interpretability. The consistency across diverse QA datasets suggests this is a general model characteristic rather than a dataset-specific artifact.