## Line Graphs: Llama-3-8B and Llama-3-70B Performance Comparison
### Overview
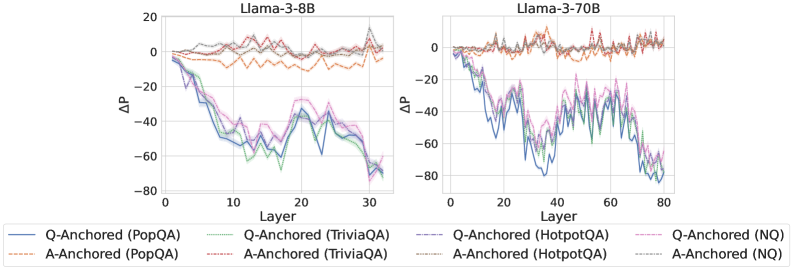
The image contains two side-by-side line graphs comparing performance metrics (ΔP) across layers for different model configurations of Llama-3-8B and Llama-3-70B. Each graph tracks six distinct data series representing variations in anchoring strategies (Q-Anchored vs. A-Anchored) and datasets (PopQA, TriviaQA, HotpotQA, NQ). The graphs show significant fluctuations in ΔP values across layers, with notable differences between model sizes.
### Components/Axes
- **X-axis (Layer)**:
- Llama-3-8B: 0–30 (discrete increments)
- Llama-3-70B: 0–80 (discrete increments)
- **Y-axis (ΔP)**:
- Range: -80 to 20 (continuous scale)
- Gridlines at 20-unit intervals
- **Legend**:
- Position: Bottom center
- Entries (color-coded):
- Q-Anchored (PopQA): Solid blue
- A-Anchored (PopQA): Dashed orange
- Q-Anchored (TriviaQA): Solid green
- A-Anchored (TriviaQA): Dashed red
- Q-Anchored (HotpotQA): Solid purple
- A-Anchored (HotpotQA): Dashed gray
- Q-Anchored (NQ): Solid pink
- A-Anchored (NQ): Dashed black
### Detailed Analysis
#### Llama-3-8B Graph
- **Q-Anchored (PopQA)**:
- Starts at ~0ΔP, trends downward to ~-60ΔP by layer 30
- Sharpest drop between layers 5–15
- **A-Anchored (PopQA)**:
- Starts at ~0ΔP, fluctuates between -10ΔP and 10ΔP
- Minimal net change
- **Q-Anchored (TriviaQA)**:
- Starts at ~0ΔP, drops to ~-50ΔP by layer 20
- Gradual decline with minor oscillations
- **A-Anchored (TriviaQA)**:
- Starts at ~0ΔP, peaks at ~15ΔP (layer 10), then declines to ~-30ΔP
- **Q-Anchored (HotpotQA)**:
- Starts at ~0ΔP, drops to ~-70ΔP by layer 30
- Steepest decline among all series
- **A-Anchored (HotpotQA)**:
- Starts at ~0ΔP, fluctuates between -20ΔP and 10ΔP
- **Q-Anchored (NQ)**:
- Starts at ~0ΔP, drops to ~-40ΔP by layer 30
- Moderate decline with mid-layer peaks
- **A-Anchored (NQ)**:
- Starts at ~0ΔP, fluctuates between -15ΔP and 5ΔP
#### Llama-3-70B Graph
- **Q-Anchored (PopQA)**:
- Starts at ~0ΔP, drops to ~-70ΔP by layer 40
- Sharp decline followed by stabilization
- **A-Anchored (PopQA)**:
- Starts at ~0ΔP, fluctuates between -5ΔP and 5ΔP
- Minimal net change
- **Q-Anchored (TriviaQA)**:
- Starts at ~0ΔP, drops to ~-60ΔP by layer 60
- Gradual decline with mid-layer oscillations
- **A-Anchored (TriviaQA)**:
- Starts at ~0ΔP, peaks at ~20ΔP (layer 20), then declines to ~-40ΔP
- **Q-Anchored (HotpotQA)**:
- Starts at ~0ΔP, drops to ~-80ΔP by layer 80
- Steepest and most sustained decline
- **A-Anchored (HotpotQA)**:
- Starts at ~0ΔP, fluctuates between -30ΔP and 10ΔP
- **Q-Anchored (NQ)**:
- Starts at ~0ΔP, drops to ~-50ΔP by layer 80
- Moderate decline with mid-layer peaks
- **A-Anchored (NQ)**:
- Starts at ~0ΔP, fluctuates between -20ΔP and 10ΔP
### Key Observations
1. **Model Size Impact**: Llama-3-70B shows more pronounced fluctuations and steeper declines in ΔP compared to Llama-3-8B.
2. **Anchoring Strategy**:
- Q-Anchored models consistently show larger negative ΔP values across datasets.
- A-Anchored models exhibit smaller magnitude changes but greater variability.
3. **Dataset Sensitivity**:
- HotpotQA triggers the largest ΔP drops in both models.
- NQ (No Query) shows the least severe declines.
4. **Layer Dynamics**:
- Early layers (0–20) exhibit the most significant ΔP changes.
- Later layers (40–80 for 70B) show stabilization or minor fluctuations.
### Interpretation
The data suggests that anchoring strategies significantly influence model performance across layers. Q-Anchored configurations (query-focused) demonstrate greater sensitivity to dataset complexity, particularly with HotpotQA, resulting in larger ΔP drops. A-Anchored models (answer-focused) show more stability but less performance differentiation between datasets. The larger Llama-3-70B model amplifies these trends, indicating that scale exacerbates dataset-specific performance gaps. The NQ baseline suggests that query anchoring inherently introduces performance variability compared to answer anchoring. These patterns highlight trade-offs between query specificity and generalization in large language models.