## Line Chart: Performance Comparison of Transformers and DynTS
### Overview
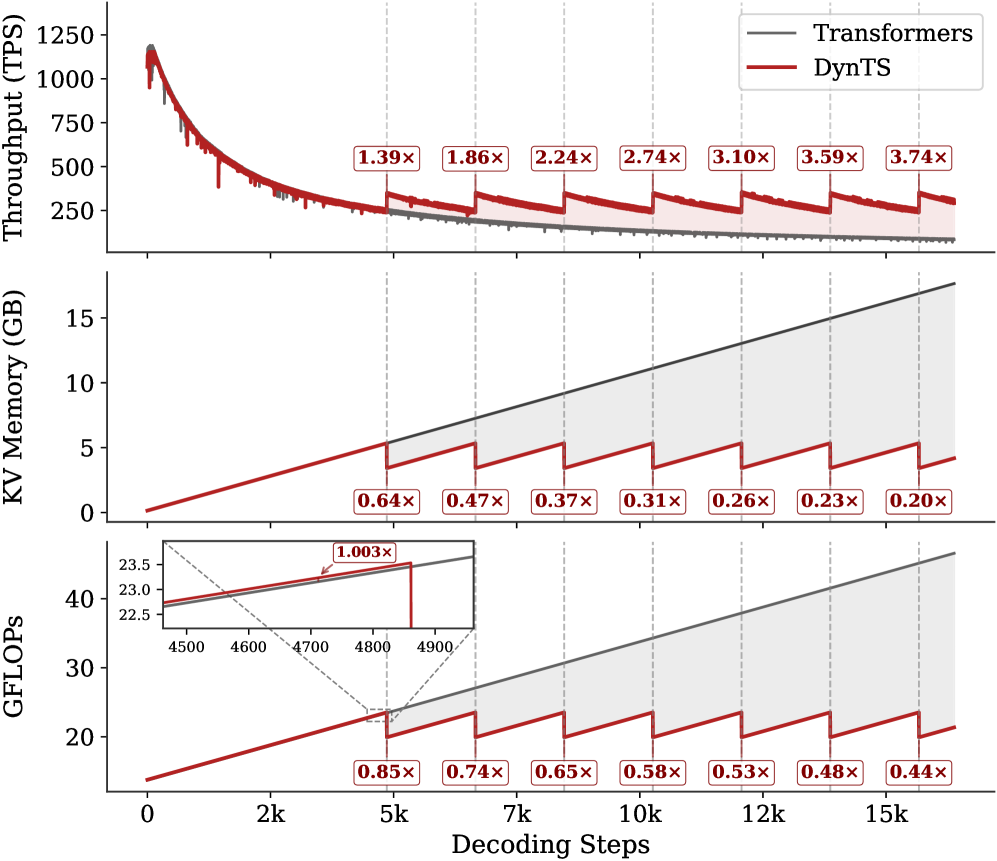
This image presents a comparative performance analysis of two models, "Transformers" and "DynTS", across three metrics: Throughput (TPS), KV Memory (GB), and GFLOPs. The performance is evaluated as a function of "Decoding Steps", ranging from 0 to 15k. The chart consists of three sub-charts stacked vertically, each representing one of the performance metrics. Each sub-chart displays two lines representing the performance of each model. Numerical multipliers are displayed above each data point.
### Components/Axes
* **X-axis (all sub-charts):** Decoding Steps (Scale: 0k, 2k, 5k, 7k, 10k, 12k, 15k)
* **Top Sub-chart (Throughput):**
* Y-axis: Throughput (TPS) (Scale: 0, 250, 500, 750, 1000, 1250)
* **Middle Sub-chart (KV Memory):**
* Y-axis: KV Memory (GB) (Scale: 0, 5, 10, 15)
* **Bottom Sub-chart (GFLOPs):**
* Y-axis: GFLOPs (Scale: 0, 20, 40)
* **Legend (top-right of the entire chart):**
* Black Line: Transformers
* Red Line: DynTS
### Detailed Analysis or Content Details
**1. Throughput (TPS)**
* **Transformers (Black Line):** The line starts at approximately 1100 TPS at 0 Decoding Steps and gradually decreases to approximately 270 TPS at 15k Decoding Steps. The trend is a slow, relatively linear decline.
* 0k: 1100 TPS
* 2k: 950 TPS
* 5k: 750 TPS
* 7k: 650 TPS
* 10k: 550 TPS
* 12k: 450 TPS
* 15k: 270 TPS
* **DynTS (Red Line):** The line starts at approximately 800 TPS at 0 Decoding Steps and decreases more rapidly than Transformers, reaching approximately 150 TPS at 15k Decoding Steps. The trend is a steeper, relatively linear decline.
* 0k: 800 TPS
* 2k: 650 TPS
* 5k: 450 TPS
* 7k: 350 TPS
* 10k: 250 TPS
* 12k: 200 TPS
* 15k: 150 TPS
* Multipliers:
* Transformers: 1.39x, 1.86x, 2.24x, 2.74x, 3.10x, 3.59x, 3.74x
* DynTS: 1.39x, 1.86x, 2.24x, 2.74x, 3.10x, 3.59x, 3.74x
**2. KV Memory (GB)**
* **Transformers (Black Line):** The line starts at approximately 0.2 GB at 0 Decoding Steps and increases linearly to approximately 14 GB at 15k Decoding Steps.
* 0k: 0.2 GB
* 2k: 1.3 GB
* 5k: 3.2 GB
* 7k: 4.9 GB
* 10k: 7.0 GB
* 12k: 9.0 GB
* 15k: 14 GB
* **DynTS (Red Line):** The line starts at approximately 0.8 GB at 0 Decoding Steps and increases linearly to approximately 1.8 GB at 15k Decoding Steps.
* 0k: 0.8 GB
* 2k: 1.9 GB
* 5k: 3.0 GB
* 7k: 4.1 GB
* 10k: 5.2 GB
* 12k: 6.3 GB
* 15k: 1.8 GB
* Multipliers:
* Transformers: 0.64x, 0.47x, 0.37x, 0.31x, 0.26x, 0.23x, 0.20x
* DynTS: 0.64x, 0.47x, 0.37x, 0.31x, 0.26x, 0.23x, 0.20x
**3. GFLOPs**
* **Transformers (Black Line):** The line starts at approximately 42 GFLOPs at 0 Decoding Steps and decreases to approximately 20 GFLOPs at 15k Decoding Steps.
* 0k: 42 GFLOPs
* 2k: 35 GFLOPs
* 5k: 28 GFLOPs
* 7k: 25 GFLOPs
* 10k: 22 GFLOPs
* 12k: 21 GFLOPs
* 15k: 20 GFLOPs
* **DynTS (Red Line):** The line starts at approximately 40 GFLOPs at 0 Decoding Steps and decreases to approximately 15 GFLOPs at 15k Decoding Steps.
* 0k: 40 GFLOPs
* 2k: 33 GFLOPs
* 5k: 25 GFLOPs
* 7k: 22 GFLOPs
* 10k: 19 GFLOPs
* 12k: 17 GFLOPs
* 15k: 15 GFLOPs
* Multipliers:
* Transformers: 0.85x, 0.74x, 0.65x, 0.58x, 0.53x, 0.48x, 0.44x
* DynTS: 0.85x, 0.74x, 0.65x, 0.58x, 0.53x, 0.48x, 0.44x
### Key Observations
* Transformers consistently exhibit higher throughput than DynTS across all decoding steps.
* DynTS requires significantly less KV memory than Transformers.
* Both models show a decrease in throughput and GFLOPs as decoding steps increase.
* The multipliers are identical for both models across all metrics, suggesting a consistent scaling relationship.
* The bottom chart (GFLOPs) has a zoomed-in section from 4500 to 4900, showing a more detailed view of the initial decline in GFLOPs.
### Interpretation
The data suggests that while Transformers offer higher throughput, DynTS is more memory-efficient. The consistent multipliers indicate that the performance degradation of both models with increasing decoding steps is proportional. This trade-off between throughput and memory usage could be crucial depending on the application's constraints. For example, in resource-constrained environments, DynTS might be preferred despite its lower throughput. The identical multipliers across metrics suggest a fundamental relationship between these performance indicators for both models. The zoomed-in section of the GFLOPs chart highlights the initial rapid decline in computational cost as decoding steps increase, potentially indicating an initial overhead that diminishes with longer sequences. The consistent decline in throughput and GFLOPs with increasing decoding steps suggests a computational bottleneck that becomes more pronounced as the sequence length grows.