## Chart: Test Accuracy on GSM8K with Scaled Inference Compute
### Overview
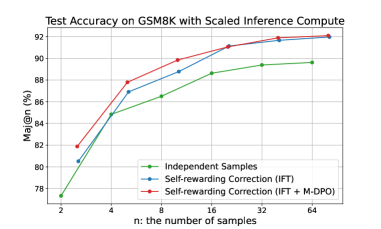
The image is a line chart comparing the test accuracy of different methods on the GSM8K dataset as the number of samples (n) increases. The chart displays three data series: "Independent Samples", "Self-rewarding Correction (IFT)", and "Self-rewarding Correction (IFT + M-DPO)". The x-axis represents the number of samples (n), and the y-axis represents the accuracy (Maj@n (%)).
### Components/Axes
* **Title:** Test Accuracy on GSM8K with Scaled Inference Compute
* **X-axis:**
* Label: n: the number of samples
* Scale: 2, 4, 8, 16, 32, 64
* **Y-axis:**
* Label: Maj@n (%)
* Scale: 78, 80, 82, 84, 86, 88, 90, 92
* **Legend:** Located in the bottom-right of the chart.
* Green: Independent Samples
* Blue: Self-rewarding Correction (IFT)
* Red: Self-rewarding Correction (IFT + M-DPO)
### Detailed Analysis
* **Independent Samples (Green):** The accuracy increases as the number of samples increases.
* n=2: Accuracy ≈ 77.3%
* n=4: Accuracy ≈ 85.0%
* n=8: Accuracy ≈ 86.5%
* n=16: Accuracy ≈ 88.5%
* n=32: Accuracy ≈ 89.5%
* n=64: Accuracy ≈ 89.5%
* **Self-rewarding Correction (IFT) (Blue):** The accuracy increases as the number of samples increases.
* n=2: Accuracy ≈ 80.5%
* n=4: Accuracy ≈ 87.0%
* n=8: Accuracy ≈ 89.0%
* n=16: Accuracy ≈ 90.0%
* n=32: Accuracy ≈ 91.8%
* n=64: Accuracy ≈ 92.0%
* **Self-rewarding Correction (IFT + M-DPO) (Red):** The accuracy increases as the number of samples increases.
* n=2: Accuracy ≈ 82.0%
* n=4: Accuracy ≈ 87.8%
* n=8: Accuracy ≈ 90.0%
* n=16: Accuracy ≈ 91.0%
* n=32: Accuracy ≈ 91.8%
* n=64: Accuracy ≈ 92.0%
### Key Observations
* All three methods show an increase in accuracy as the number of samples increases.
* The "Self-rewarding Correction (IFT + M-DPO)" method (red line) generally performs better than the "Self-rewarding Correction (IFT)" method (blue line), especially at lower sample sizes.
* The "Independent Samples" method (green line) consistently performs worse than the other two methods across all sample sizes.
* The performance of "Self-rewarding Correction (IFT)" and "Self-rewarding Correction (IFT + M-DPO)" converges as the number of samples increases.
### Interpretation
The chart demonstrates that using self-rewarding correction methods, particularly "Self-rewarding Correction (IFT + M-DPO)", improves the test accuracy on the GSM8K dataset compared to using independent samples. The improvement is more significant at lower sample sizes. As the number of samples increases, the performance of the two self-rewarding correction methods becomes similar, suggesting that the additional M-DPO component provides less benefit with more samples. The data suggests that self-rewarding correction techniques are effective in improving the accuracy of models on the GSM8K dataset, especially when computational resources are limited (i.e., lower sample sizes).