\n
## Line Chart: Test Accuracy on GSM8K with Scaled Inference Compute
### Overview
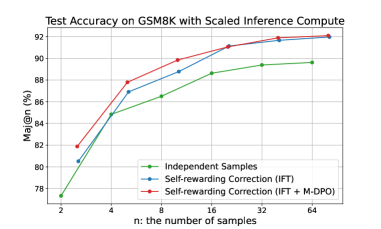
This line chart displays the relationship between the number of samples ('n') and the test accuracy (Maj@n (%)) on the GSM8K dataset, using different training methods. The chart compares the performance of "Independent Samples", "Self-rewarding Correction (IFT)", and "Self-rewarding Correction (IFT + M-DPO)".
### Components/Axes
* **Title:** "Test Accuracy on GSM8K with Scaled Inference Compute" (positioned at the top-center)
* **X-axis:** "n: the number of samples" (ranging from 2 to 64, logarithmic scale)
* **Y-axis:** "Maj@n (%)" (ranging from 78% to 92%)
* **Legend:** Located in the bottom-right corner, identifying the three data series:
* Green: "Independent Samples"
* Blue: "Self-rewarding Correction (IFT)"
* Red: "Self-rewarding Correction (IFT + M-DPO)"
### Detailed Analysis
The chart shows three lines representing the accuracy of each method as the number of samples increases.
* **Independent Samples (Green Line):** The line slopes upward, indicating increasing accuracy with more samples.
* n=2: Approximately 77.5%
* n=4: Approximately 81.5%
* n=8: Approximately 85.5%
* n=16: Approximately 88.5%
* n=32: Approximately 89.5%
* n=64: Approximately 90%
* **Self-rewarding Correction (IFT) (Blue Line):** This line also slopes upward, but starts higher than the "Independent Samples" line and has a steeper initial slope.
* n=2: Approximately 81%
* n=4: Approximately 85%
* n=8: Approximately 88.5%
* n=16: Approximately 89.5%
* n=32: Approximately 90.5%
* n=64: Approximately 91%
* **Self-rewarding Correction (IFT + M-DPO) (Red Line):** This line exhibits the steepest upward slope and consistently achieves the highest accuracy across all sample sizes.
* n=2: Approximately 80.5%
* n=4: Approximately 86.5%
* n=8: Approximately 89.5%
* n=16: Approximately 91%
* n=32: Approximately 91.5%
* n=64: Approximately 92%
### Key Observations
* The "Self-rewarding Correction (IFT + M-DPO)" method consistently outperforms both "Independent Samples" and "Self-rewarding Correction (IFT)" across all sample sizes.
* The performance gap between the methods widens as the number of samples increases.
* All three methods demonstrate increasing accuracy with more samples, suggesting that scaling the number of samples is beneficial for all approaches.
### Interpretation
The data suggests that incorporating self-rewarding correction, particularly when combined with M-DPO, significantly improves test accuracy on the GSM8K dataset. The consistent outperformance of the "Self-rewarding Correction (IFT + M-DPO)" method indicates that this approach is more effective at leveraging the available data. The increasing accuracy with more samples for all methods highlights the importance of data quantity in achieving high performance. The steeper slope of the red line suggests that the benefits of M-DPO are more pronounced with larger datasets. This chart demonstrates the effectiveness of reinforcement learning techniques (IFT and M-DPO) in improving the performance of models on mathematical reasoning tasks (GSM8K).