## Line Chart: Test Accuracy on GSM8K with Scaled Inference Compute
### Overview
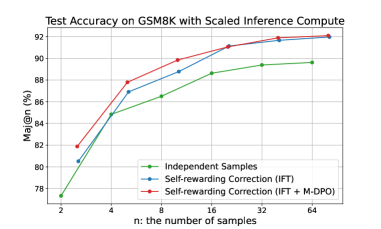
This image is a line chart titled "Test Accuracy on GSM8K with Scaled Inference Compute." It plots the performance of three different methods for improving the accuracy of a model on the GSM8K math reasoning benchmark as the number of inference samples (`n`) is scaled. The chart demonstrates that increasing the number of samples improves accuracy for all methods, with one method consistently outperforming the others.
### Components/Axes
* **Chart Title:** "Test Accuracy on GSM8K with Scaled Inference Compute" (centered at the top).
* **Y-Axis:** Labeled "Maj@n (%)". The scale runs from 78 to 92, with major gridlines at intervals of 2 (78, 80, 82, 84, 86, 88, 90, 92). This represents the majority vote accuracy percentage over `n` samples.
* **X-Axis:** Labeled "n: the number of samples". The scale is logarithmic, with labeled tick marks at 2, 4, 8, 16, 32, and 64.
* **Legend:** Located in the bottom-right corner of the plot area. It contains three entries:
1. **Green line with circle markers:** "Independent Samples"
2. **Blue line with circle markers:** "Self-rewarding Correction (IFT)"
3. **Red line with circle markers:** "Self-rewarding Correction (IFT + M-DPO)"
* **Grid:** A light gray grid is present for both major x and y axis ticks.
### Detailed Analysis
The chart displays three data series, each showing an upward trend as `n` increases.
**1. Independent Samples (Green Line)**
* **Trend:** Slopes upward steadily but is the lowest-performing method across all values of `n`.
* **Data Points (Approximate):**
* n=2: ~77.5%
* n=4: ~85.0%
* n=8: ~86.5%
* n=16: ~88.5%
* n=32: ~89.5%
* n=64: ~90.0%
**2. Self-rewarding Correction (IFT) (Blue Line)**
* **Trend:** Slopes upward, consistently positioned between the green and red lines.
* **Data Points (Approximate):**
* n=2: ~80.5%
* n=4: ~87.0%
* n=8: ~88.5%
* n=16: ~91.0%
* n=32: ~91.5%
* n=64: ~92.0%
**3. Self-rewarding Correction (IFT + M-DPO) (Red Line)**
* **Trend:** Slopes upward most steeply initially and maintains the highest position throughout.
* **Data Points (Approximate):**
* n=2: ~82.0%
* n=4: ~88.0%
* n=8: ~90.0%
* n=16: ~91.5%
* n=32: ~92.0%
* n=64: ~92.2%
### Key Observations
1. **Performance Hierarchy:** There is a clear and consistent performance hierarchy: IFT + M-DPO (red) > IFT (blue) > Independent Samples (green) at every measured value of `n`.
2. **Diminishing Returns:** All three curves show diminishing returns. The accuracy gain from doubling `n` is largest when moving from n=2 to n=4 and becomes progressively smaller as `n` increases. The curves begin to plateau after n=16.
3. **Convergence at High `n`:** The performance gap between the three methods narrows significantly as `n` increases. At n=64, the difference between the best (red) and worst (green) method is only about 2.2 percentage points, compared to a gap of ~4.5 points at n=2.
4. **Steep Initial Gains:** The most dramatic accuracy improvements for all methods occur in the low-`n` regime (n=2 to n=8).
### Interpretation
This chart provides a technical comparison of inference-time compute strategies for a language model on a mathematical reasoning task. The data suggests several key insights:
* **Value of Scaled Compute:** Simply generating more samples (`n`) and taking a majority vote ("Independent Samples") reliably improves accuracy, confirming the benefit of increased inference compute.
* **Superiority of Advanced Correction:** The "Self-rewarding Correction" methods, which likely involve the model iteratively critiquing and refining its own outputs, are more sample-efficient. They achieve higher accuracy with the same `n` compared to naive sampling.
* **Impact of Alignment (M-DPO):** Adding M-DPO (likely a form of model alignment or preference optimization) to the IFT (Instruction Fine-Tuning) correction method yields the best results. This implies that aligning the model's self-correction process with human preferences or a reward model significantly boosts its effectiveness on this reasoning task.
* **Practical Implication:** For applications where inference cost/latency is a concern (low `n`), using the more sophisticated IFT + M-DPO method provides a substantial accuracy benefit. For scenarios where compute is less constrained (high `n`), the performance advantage of the advanced methods diminishes, though they remain superior. The chart helps a practitioner choose a method based on their available compute budget (`n`) and required accuracy.