## Line Chart: Test Accuracy on GSM8K with Scaled Inference Compute
### Overview
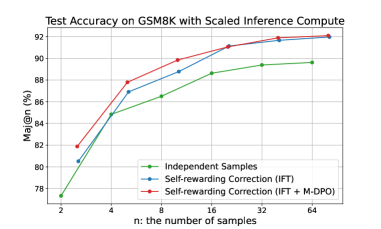
The chart illustrates the relationship between the number of samples (`n`) and test accuracy (Maj@n %) for three distinct methods: Independent Samples, Self-rewarding Correction (IFT), and Self-rewarding Correction (IFT + M-DPO). Accuracy improves as the number of samples increases, with the IFT + M-DPO method consistently outperforming the others.
### Components/Axes
- **X-axis**: `n: the number of samples` (values: 2, 4, 8, 16, 32, 64).
- **Y-axis**: `Maj@n (%)` (range: 78% to 92%).
- **Legend**: Located at the bottom-right corner, with three entries:
- Green line: Independent Samples
- Blue line: Self-rewarding Correction (IFT)
- Red line: Self-rewarding Correction (IFT + M-DPO)
### Detailed Analysis
1. **Independent Samples (Green Line)**:
- Starts at **77.5%** at `n=2`.
- Gradually increases to **89.5%** at `n=64`.
- Slope: Moderate upward trend.
2. **Self-rewarding Correction (IFT) (Blue Line)**:
- Starts at **80.5%** at `n=2`.
- Rises sharply to **91.8%** at `n=64`.
- Slope: Steeper than Independent Samples, with a plateau near `n=32`.
3. **Self-rewarding Correction (IFT + M-DPO) (Red Line)**:
- Starts at **81.5%** at `n=2`.
- Peaks at **92.2%** at `n=64`.
- Slope: Steepest initial rise, maintaining the highest accuracy across all `n`.
### Key Observations
- The **red line (IFT + M-DPO)** consistently outperforms the other methods, achieving the highest accuracy at every sample size.
- The **blue line (IFT)** surpasses the green line (Independent Samples) at `n=4` and maintains a lead thereafter.
- All methods show diminishing returns as `n` increases beyond 32, with accuracy gains becoming smaller.
### Interpretation
The data demonstrates that **self-rewarding correction mechanisms** (particularly when combined with M-DPO) significantly enhance test accuracy on GSM8K compared to independent sampling. The scaling of inference compute (increasing `n`) benefits all methods, but the synergistic effect of IFT and M-DPO yields the most robust performance. This suggests that integrating self-rewarding strategies with M-DPO could be critical for optimizing large language model evaluations. The plateau observed in the blue line at higher `n` implies potential saturation limits for IFT alone, whereas the red line’s sustained growth indicates greater scalability.