## 3D Surface Plot: True Error vs. x1 and x2
### Overview
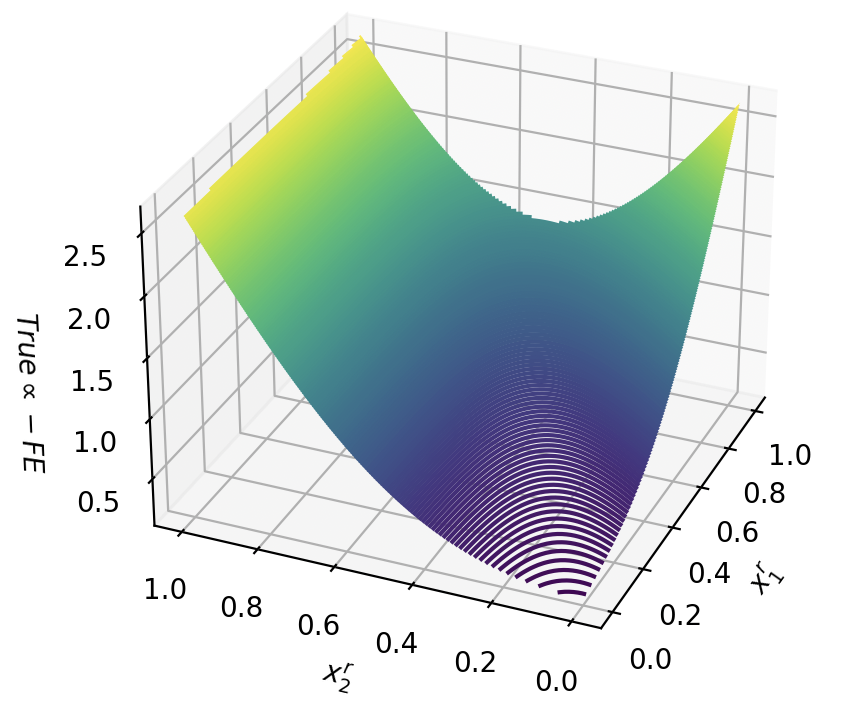
The image is a 3D surface plot visualizing the relationship between two variables, x1 and x2, and a third variable representing the "True ∞ - FE" error. The surface shows how the error changes as x1 and x2 vary from 0 to 1. The surface is colored, with the color gradient indicating the magnitude of the error, ranging from dark purple (low error) to yellow (high error).
### Components/Axes
* **X-axis:** Labeled "x'1", ranging from 0.0 to 1.0 in increments of 0.2.
* **Y-axis:** Labeled "x'2", ranging from 0.0 to 1.0 in increments of 0.2.
* **Z-axis:** Labeled "True ∞ - FE", ranging from 0.5 to 2.5 in increments of 0.5.
* **Color Gradient:** The surface is colored, with dark purple indicating lower values of "True ∞ - FE" and yellow indicating higher values.
### Detailed Analysis
* **X-axis (x'1):** The x'1 axis ranges from 0.0 to 1.0.
* **Y-axis (x'2):** The x'2 axis ranges from 0.0 to 1.0.
* **Z-axis (True ∞ - FE):** The z-axis ranges from 0.5 to 2.5.
* **Surface Trend:** The surface forms a valley-like shape. The lowest point of the surface, representing the minimum error, appears to be located near the origin (x'1 = 0, x'2 = 0). As x'1 and x'2 increase, the error generally increases, forming upward sloping sides. The error appears to increase more rapidly as x'1 and x'2 approach 1.0.
* **Color Mapping:** The color of the surface transitions from dark purple near the origin to yellow as x'1 and x'2 approach 1.0, indicating an increase in the "True ∞ - FE" value.
### Key Observations
* The minimum error occurs when both x'1 and x'2 are close to 0.
* The error increases as x'1 and x'2 increase.
* The rate of error increase appears to be higher as x'1 and x'2 approach 1.
### Interpretation
The 3D surface plot visualizes the error ("True ∞ - FE") as a function of two input variables, x'1 and x'2. The plot suggests that the error is minimized when both x'1 and x'2 are close to zero. As the values of x'1 and x'2 increase, the error increases, indicating that the accuracy of the "FE" approximation decreases as x'1 and x'2 move away from zero. The valley shape of the surface indicates a non-linear relationship between the input variables and the error. The plot could represent the error in a finite element (FE) simulation compared to the true value, where x'1 and x'2 are parameters influencing the simulation.