\n
## 3D Surface Plot: True α – FE
### Overview
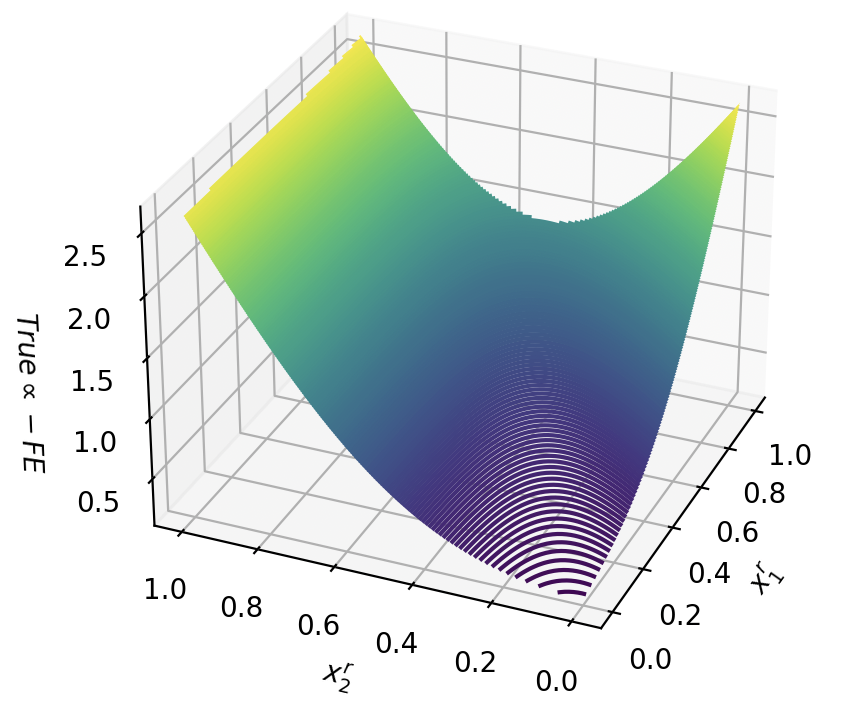
The image depicts a 3D surface plot representing the relationship between two input variables, x₁ and x₂, and the output variable "True α – FE". The surface is colored, indicating varying values of "True α – FE". The plot appears to show a complex, non-linear relationship between the input variables and the output.
### Components/Axes
* **X-axis:** Labeled "x₁", ranging from approximately 0.0 to 1.0, with markers at 0.2, 0.4, 0.6, 0.8, and 1.0.
* **Y-axis:** Labeled "x₂", ranging from approximately 0.0 to 1.0, with markers at 0.2, 0.4, 0.6, 0.8, and 1.0.
* **Z-axis:** Labeled "True α – FE", ranging from approximately 0.0 to 2.5, with markers at 0.5, 1.0, 1.5, 2.0, and 2.5.
* **Surface:** The surface itself represents the values of "True α – FE" for different combinations of x₁ and x₂. The surface is colored with a gradient, transitioning from darker blues at lower values to lighter greens and yellows at higher values.
### Detailed Analysis
The surface exhibits a complex shape. It generally increases in value as both x₁ and x₂ increase, but the rate of increase is not constant. There appears to be a region of rapid increase along the diagonal where x₁ ≈ x₂.
* **Minimum Value:** The minimum value of "True α – FE" appears to be close to 0.0, located near x₁ = 0.0 and x₂ = 0.0.
* **Maximum Value:** The maximum value of "True α – FE" appears to be around 2.5, located near x₁ = 1.0 and x₂ = 1.0.
* **Trend along x₁:** For a fixed value of x₂, the surface generally slopes upward as x₁ increases.
* **Trend along x₂:** For a fixed value of x₁, the surface generally slopes upward as x₂ increases.
* **Curvature:** The surface exhibits significant curvature, indicating a non-linear relationship. The curvature is more pronounced near the center of the plot.
* **Wavy Pattern:** There is a noticeable wavy pattern visible in the lower-left corner of the plot, where x₁ and x₂ are both small. This suggests oscillations or interference in the relationship.
### Key Observations
* The surface is not symmetrical with respect to either x₁ or x₂.
* The rate of change of "True α – FE" is not uniform across the entire range of x₁ and x₂.
* The wavy pattern in the lower-left corner is a notable feature that may indicate a specific phenomenon or limitation of the model.
### Interpretation
The plot suggests a complex, non-linear relationship between the input variables x₁ and x₂ and the output variable "True α – FE". The increasing trend indicates that higher values of x₁ and x₂ generally lead to higher values of "True α – FE". However, the curvature and asymmetry suggest that the relationship is not simple and may be sensitive to the specific values of x₁ and x₂. The wavy pattern in the lower-left corner could be due to numerical instability, interference effects, or a fundamental property of the underlying system.
Without further context, it is difficult to determine the specific meaning of "True α – FE" or the physical significance of x₁ and x₂. However, the plot provides valuable insights into the behavior of the system and can be used to guide further analysis or modeling. The plot could represent a response surface in an optimization problem, a physical phenomenon modeled by a complex equation, or a simulation result.