## 3D Surface Plot: True α - FE as a Function of x₁ʳ and x₂ʳ
### Overview
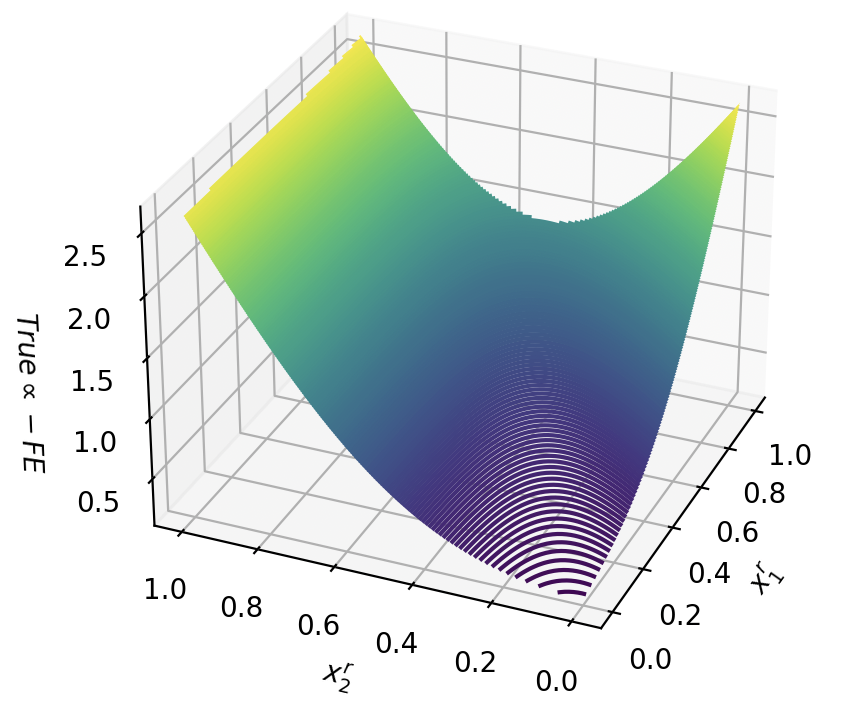
The image displays a three-dimensional surface plot visualizing a mathematical function. The plot shows how a dependent variable, labeled "True α - FE", varies as a function of two independent variables, "x₁ʳ" and "x₂ʳ". The surface exhibits a distinct saddle shape, with high values at the corners of the domain and a low valley along the main diagonal.
### Components/Axes
* **Vertical Axis (Z-axis):**
* **Label:** `True α - FE`
* **Scale:** Linear, ranging from approximately 0.5 to 2.5.
* **Tick Marks:** 0.5, 1.0, 1.5, 2.0, 2.5.
* **Horizontal Axis 1 (X-axis, right side):**
* **Label:** `x₁ʳ`
* **Scale:** Linear, ranging from 0.0 to 1.0.
* **Tick Marks:** 0.0, 0.2, 0.4, 0.6, 0.8, 1.0.
* **Horizontal Axis 2 (Y-axis, bottom):**
* **Label:** `x₂ʳ`
* **Scale:** Linear, ranging from 0.0 to 1.0.
* **Tick Marks:** 0.0, 0.2, 0.4, 0.6, 0.8, 1.0.
* **Surface Color Mapping:** The surface color corresponds to the value of "True α - FE". There is no separate legend; the mapping is implicit.
* **Yellow/Light Green:** Represents high values (≈ 2.0 - 2.5).
* **Teal/Green:** Represents mid-range values (≈ 1.0 - 2.0).
* **Dark Blue/Purple:** Represents low values (≈ 0.5 - 1.0).
### Detailed Analysis
The surface is defined over a square domain where both `x₁ʳ` and `x₂ʳ` range from 0.0 to 1.0.
**Trend Verification & Key Data Points:**
1. **High-Value Corners:** The surface reaches its maximum height (≈ 2.5, colored yellow) at the two opposite corners of the domain:
* At `(x₁ʳ ≈ 0.0, x₂ʳ ≈ 0.0)`.
* At `(x₁ʳ ≈ 1.0, x₂ʳ ≈ 1.0)`.
2. **Low-Value Diagonal Valley:** The surface forms a deep, curved valley along the line where `x₁ʳ ≈ x₂ʳ`. The minimum value (≈ 0.5, colored dark blue/purple) appears to be at the center of this valley, near `(x₁ʳ ≈ 0.5, x₂ʳ ≈ 0.5)`.
3. **Symmetry:** The plot is symmetric about the plane `x₁ʳ = x₂ʳ`. The shape and values are mirrored across this diagonal.
4. **Gradient:** Moving perpendicularly away from the `x₁ʳ = x₂ʳ` diagonal in either direction causes the surface to rise steeply. The gradient is steepest near the center of the domain and becomes more gradual near the high-value corners.
### Key Observations
* **Saddle Shape:** The primary geometric feature is a saddle (or hyperbolic paraboloid). This indicates that the function has a minimax property: it is minimized along one direction (the diagonal) and maximized along the orthogonal direction.
* **Color as Value Indicator:** The color gradient provides a strong visual cue for the function's value, perfectly correlating with the surface height. Yellow consistently marks the highest points, and dark blue/purple marks the lowest.
* **Smoothness:** The surface appears perfectly smooth with no discontinuities, sharp edges, or outliers, suggesting the underlying function is continuous and differentiable over the given domain.
### Interpretation
This plot visualizes a function where the output `True α - FE` is minimized when the two input parameters `x₁ʳ` and `x₂ʳ` are equal. Any imbalance or difference between `x₁ʳ` and `x₂ʳ` causes the output to increase. The increase is symmetric with respect to which variable is larger.
The function's behavior suggests a system where **balance or equality between the two factors (`x₁ʳ` and `x₂ʳ`) leads to an optimal (minimal) state** of `True α - FE`. The further the system moves from this balanced state (i.e., the greater the disparity between `x₁ʳ` and `x₂ʳ`), the worse (higher) the outcome becomes. The saddle shape implies that the penalty for imbalance is severe, as the surface rises rapidly away from the diagonal valley.
Without specific context for what `True α - FE`, `x₁ʳ`, and `x₂ʳ` represent, this could model scenarios such as:
* An error or cost function in an optimization problem.
* A measure of system instability or inefficiency.
* A physical property that depends on the ratio or difference between two normalized quantities.
The plot effectively communicates that controlling for the equality of `x₁ʳ` and `x₂ʳ` is critical for minimizing the target metric.