\n
## Bar Chart: CiteME Papers by Year Published
### Overview
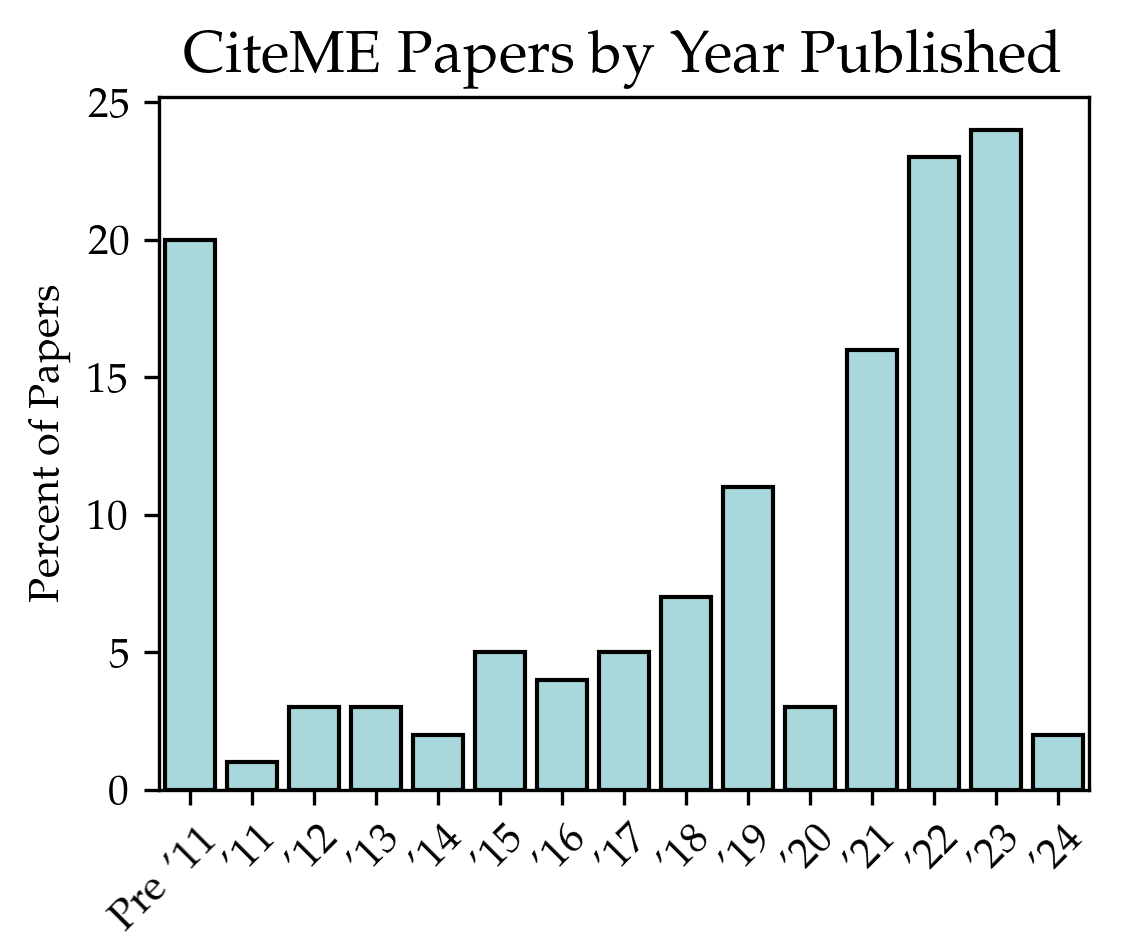
This image presents a bar chart illustrating the percentage of CiteME papers published each year from before 2011 ('Pre') to 2024. The chart uses a light blue color for all bars. The y-axis represents the percentage of papers, while the x-axis represents the year of publication.
### Components/Axes
* **Title:** "CiteME Papers by Year Published" (positioned at the top-center)
* **X-axis Label:** Year (labeled with years 'Pre', '11', '12', '13', '14', '15', '16', '17', '18', '19', '20', '21', '22', '23', '24')
* **Y-axis Label:** "Percent of Papers" (positioned vertically on the left side)
* **Y-axis Scale:** Ranges from 0 to 25, with increments of 5.
* **Legend:** No legend is present, as only one data series is displayed.
### Detailed Analysis
The chart displays the following approximate data points:
* **Pre '11:** Approximately 20%
* **'11:** Approximately 3%
* **'12:** Approximately 3%
* **'13:** Approximately 3%
* **'14:** Approximately 2%
* **'15:** Approximately 4%
* **'16:** Approximately 5%
* **'17:** Approximately 5%
* **'18:** Approximately 6%
* **'19:** Approximately 11%
* **'20:** Approximately 3%
* **'21:** Approximately 16%
* **'22:** Approximately 23%
* **'23:** Approximately 24%
* **'24:** Approximately 2%
**Trends:**
* The percentage of papers published was high before 2011 (approximately 20%).
* There was a significant drop in publications from 2011 to 2014, with percentages hovering around 2-3%.
* Publications gradually increased from 2015 to 2019, reaching approximately 11%.
* There was a sharp decline in 2020 (approximately 3%).
* A substantial increase in publications occurred from 2021 to 2023, peaking at approximately 24% in 2023.
* A significant drop in 2024 to approximately 2%.
### Key Observations
* The most significant peak in publications occurred in 2023.
* The lowest publication rates were observed in 2020 and the years 2011-2014.
* The data suggests a cyclical pattern, with periods of growth followed by declines.
* The 2024 data point is a notable outlier, showing a dramatic decrease compared to the previous years.
### Interpretation
The chart demonstrates the publication trend of CiteME papers over time. The initial high publication rate before 2011 suggests a period of foundational work or initial project activity. The subsequent decline could indicate a stabilization phase or a shift in research focus. The resurgence in publications from 2021 onwards suggests renewed interest or significant progress in the field. The sharp drop in 2024 is a significant anomaly that warrants further investigation. It could be due to various factors, such as changes in research funding, project completion, or data collection delays. The cyclical pattern suggests that CiteME research may be subject to periodic bursts of activity followed by periods of consolidation. The data highlights the importance of considering the temporal context when analyzing research output.