## Bar Chart: CiteME Papers by Year Published
### Overview
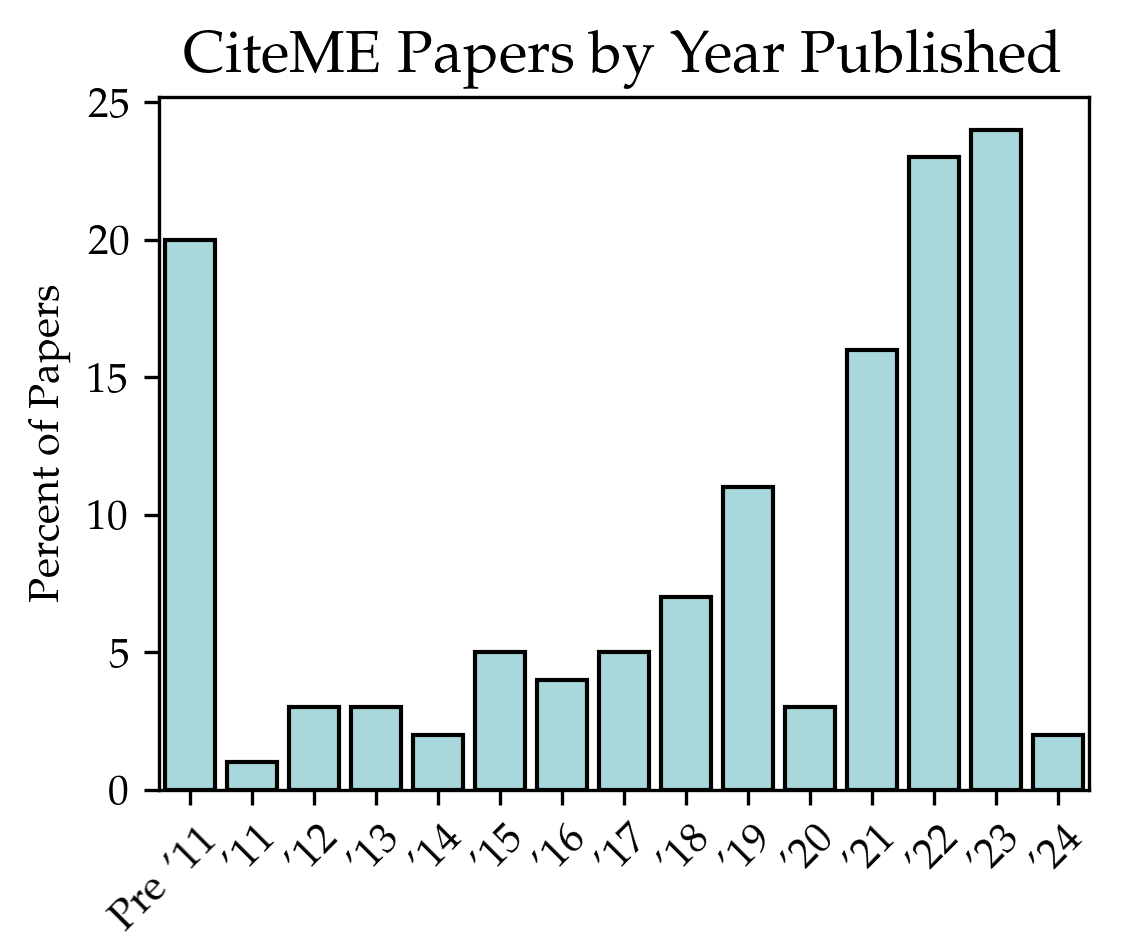
The chart displays the percentage of CiteME papers published annually from Pre '11 to '24. The y-axis represents the "Percent of Papers" (0–25%), and the x-axis lists years. Bars are light blue, with a legend confirming the color association.
### Components/Axes
- **X-axis (Years)**: Pre '11, '11, '12, '13, '14, '15, '16, '17, '18, '19, '20, '21, '22, '23, '24
- **Y-axis (Percent of Papers)**: 0–25% in increments of 5%
- **Legend**: Light blue color corresponds to "CiteME Papers"
### Detailed Analysis
- **Pre '11**: ~20%
- **'11**: ~1%
- **'12**: ~3%
- **'13**: ~3%
- **'14**: ~2%
- **'15**: ~5%
- **'16**: ~4%
- **'17**: ~7%
- **'18**: ~11%
- **'19**: ~11%
- **'20**: ~3%
- **'21**: ~16%
- **'22**: ~23%
- **'23**: ~24%
- **'24**: ~2%
### Key Observations
1. **Initial Decline**: A sharp drop from 20% (Pre '11) to 1% in '11, followed by gradual growth until '19.
2. **Post-2020 Surge**: A 10x increase from 3% in '20 to 24% in '23, followed by a sudden drop to 2% in '24.
3. **Stability (2015–2019)**: Fluctuations between 2% and 11%, with a peak in '18 and '19.
4. **Anomalies**: The 2024 value deviates significantly from the upward trend observed in 2021–2023.
### Interpretation
The data suggests a cyclical pattern in CiteME paper adoption. The pre-2011 baseline (~20%) may reflect early adoption, followed by a decline possibly due to methodological shifts or competing tools. The 2015–2019 stabilization could indicate market saturation or academic integration. The 2021–2023 surge aligns with potential technological advancements or renewed interest, though the 2024 drop raises questions about sustainability or external disruptions (e.g., platform changes, competition). The 2024 anomaly warrants further investigation into dataset completeness or contextual factors.