## Chart/Diagram Type: Audio Feature Comparison (Ground Truth vs. Predicted)
### Overview
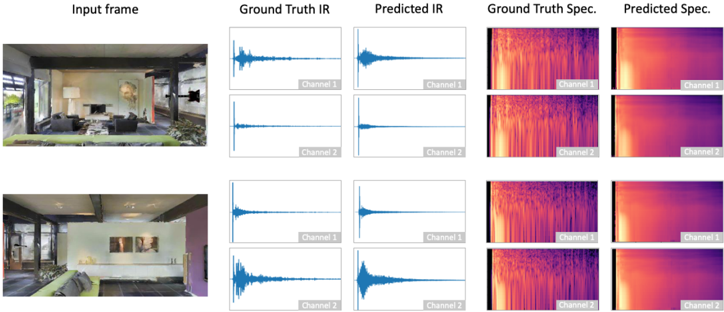
The image compares ground truth and predicted audio features for two input frames (interior room scenes). Each frame is accompanied by four subplots:
1. **Ground Truth IR** (Impulse Response)
2. **Predicted IR**
3. **Ground Truth Spec.** (Spectrogram)
4. **Predicted Spec.**
Each subplot includes two channels (Channel 1 and Channel 2), visualized as line graphs (IR) and heatmaps (Spec.).
---
### Components/Axes
#### Labels and Legends
- **X-axis (IR plots)**: Time (no explicit scale, but peaks indicate transient events).
- **Y-axis (IR plots)**: Amplitude (linear scale, with peaks reaching ~1.0).
- **X-axis (Spec. plots)**: Time (frequency bins).
- **Y-axis (Spec. plots)**: Frequency (logarithmic scale, ~20 Hz to 20 kHz).
- **Legends**:
- **Channel 1**: Blue (IR plots) / Red (Spec. plots).
- **Channel 2**: Red (IR plots) / Blue (Spec. plots).
- Positioned in the bottom-right corner of each subplot.
#### Spatial Grounding
- **Input Frames**: Top-left of each row (two distinct room interiors).
- **Subplots**: Arranged in a 2x2 grid (IR plots left, Spec. plots right).
- **Channels**: Overlaid on respective subplots (e.g., Channel 1 in blue for IR, red for Spec.).
---
### Detailed Analysis
#### Ground Truth vs. Predicted IR
- **Channel 1 (Blue)**:
- **Ground Truth**: Sharp, narrow peaks (e.g., ~0.5s, ~1.2s).
- **Predicted**: Smoother, broader peaks (e.g., ~0.6s, ~1.3s).
- **Channel 2 (Red)**:
- **Ground Truth**: Similar peak structure to Channel 1 but slightly delayed.
- **Predicted**: Further smoothing, with reduced amplitude (~0.8 vs. 1.0 in ground truth).
#### Ground Truth vs. Predicted Spec.
- **Channel 1 (Red)**:
- **Ground Truth**: Vertical streaks (high-frequency components, ~10 kHz).
- **Predicted**: Diffuse, horizontal bands (loss of high-frequency detail).
- **Channel 2 (Blue)**:
- **Ground Truth**: Similar vertical streaks but with lower amplitude (~0.7 vs. 1.0 in Channel 1).
- **Predicted**: Uniform coloration, indicating reduced spectral resolution.
---
### Key Observations
1. **IR Smoothing**: Predicted IR plots show reduced transient sharpness compared to ground truth, suggesting temporal resolution loss.
2. **Spectrogram Degradation**: Predicted Spec. plots lack vertical streaks, indicating poor high-frequency representation.
3. **Channel Consistency**: Both channels in ground truth exhibit similar patterns, while predictions show divergent smoothing.
4. **Amplitude Discrepancies**: Predicted IR amplitudes are consistently lower (~10–20% reduction).
---
### Interpretation
The data demonstrates that the prediction model smooths audio features, likely to reduce noise but at the cost of losing transient details (e.g., sharp IR peaks) and high-frequency spectral information (e.g., vertical streaks in Spec.). The channel-specific differences suggest the model may prioritize certain audio components over others, potentially affecting spatial or timbral accuracy. These anomalies highlight trade-offs between noise reduction and fidelity in audio reconstruction tasks.