# Technical Data Extraction: Training Time vs. $\beta$ (%)
## 1. Component Isolation
* **Header:** None present.
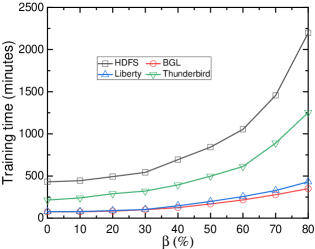
* **Main Chart:** A line graph plotted on a Cartesian coordinate system with a light gray background. It contains four distinct data series represented by different colors and markers.
* **Legend:** Located in the upper-middle section of the plot area (approximate spatial grounding: center-top, within the grid).
* **Axes:**
* **Y-axis (Vertical):** Represents "Training time (minutes)".
* **X-axis (Horizontal):** Represents "$\beta$ (%)".
---
## 2. Axis and Label Extraction
* **Y-Axis Title:** Training time (minutes)
* **Y-Axis Scale:** 0 to 2500, with major tick marks every 500 units (0, 500, 1000, 1500, 2000, 2500). Minor tick marks are present between major intervals.
* **X-Axis Title:** $\beta$ (%)
* **X-Axis Scale:** 0 to 80, with major tick marks every 10 units (0, 10, 20, 30, 40, 50, 60, 70, 80).
---
## 3. Legend and Data Series Identification
The legend is contained within a black-bordered box and identifies four datasets:
| Series Name | Line Color | Marker Shape | Visual Trend Description |
| :--- | :--- | :--- | :--- |
| **HDFS** | Black | Open Square ($\square$) | Starts highest (~450); exhibits exponential growth, especially after $\beta=40\%$. |
| **BGL** | Red | Open Circle ($\circ$) | Starts lowest (~100); remains relatively flat until $\beta=40\%$, then shows a slight upward curve. |
| **Liberty** | Blue | Open Triangle ($\triangle$) | Overlaps with BGL initially; begins to diverge upward slightly more than BGL after $\beta=30\%$. |
| **Thunderbird** | Green | Open Inverted Triangle ($\nabla$) | Starts at a moderate level (~250); shows steady growth, accelerating significantly after $\beta=50\%$. |
---
## 4. Data Point Extraction (Estimated Values)
Based on the visual alignment with the grid and axis markers, the following values are extracted:
| $\beta$ (%) | HDFS (Black $\square$) | Thunderbird (Green $\nabla$) | Liberty (Blue $\triangle$) | BGL (Red $\circ$) |
| :--- | :--- | :--- | :--- | :--- |
| **0** | ~440 | ~220 | ~80 | ~80 |
| **10** | ~450 | ~240 | ~80 | ~80 |
| **20** | ~490 | ~290 | ~90 | ~80 |
| **30** | ~540 | ~330 | ~100 | ~100 |
| **40** | ~700 | ~400 | ~150 | ~140 |
| **50** | ~850 | ~500 | ~210 | ~180 |
| **60** | ~1050 | ~610 | ~260 | ~220 |
| **70** | ~1450 | ~900 | ~330 | ~280 |
| **80** | ~2200 | ~1250 | ~430 | ~350 |
---
## 5. Key Trends and Observations
1. **Positive Correlation:** All four datasets show a positive correlation between the parameter $\beta$ (%) and the Training time (minutes). As $\beta$ increases, training time increases.
2. **Growth Rate:** The growth is non-linear for all series. The rate of increase (slope) accelerates as $\beta$ moves from 40% to 80%.
3. **Relative Performance:**
* **HDFS** is consistently the most computationally expensive dataset to train, ending at over 2000 minutes.
* **Thunderbird** represents the median complexity, ending at approximately 1250 minutes.
* **Liberty and BGL** are the most efficient. While they track closely together for the first half of the scale, Liberty becomes slightly more time-consuming than BGL as $\beta$ exceeds 40%.
4. **Critical Threshold:** There is a visible "elbow" or inflection point around $\beta = 30\% - 40\%$ for all datasets, after which the training time begins to climb much more steeply.