# Technical Document Analysis: Training Time vs. β (%)
## Chart Description
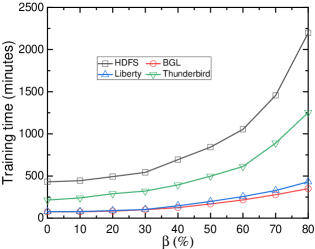
The image is a **line chart** titled **"Training time vs. β (%)"**. It visualizes the relationship between the parameter **β (percentage)** and **training time (minutes)** across four distinct algorithms. The chart spans **β = 0% to 80%** on the x-axis and **Training time = 0 to 2500 minutes** on the y-axis.
---
## Key Components
### 1. **Axis Labels**
- **X-axis**: **β (%)** (ranging from 0 to 80 in increments of 10).
- **Y-axis**: **Training time (minutes)** (ranging from 0 to 2500 in increments of 500).
### 2. **Legend**
- Located in the **top-right corner** of the chart.
- **Labels and Colors**:
- **HDFS**: Black squares (`■`).
- **BGL**: Red circles (`●`).
- **Liberty**: Blue triangles (`▲`).
- **Thunderbird**: Green triangles (`▼`).
### 3. **Data Series**
Four algorithms are plotted with distinct markers and colors:
1. **HDFS** (Black squares):
- **Trend**: Steep upward slope.
- **Data Points**:
- β = 0%: ~400 minutes.
- β = 80%: ~2200 minutes.
2. **BGL** (Red circles):
- **Trend**: Gradual upward slope.
- **Data Points**:
- β = 0%: ~10 minutes.
- β = 80%: ~300 minutes.
3. **Liberty** (Blue triangles):
- **Trend**: Moderate upward slope.
- **Data Points**:
- β = 0%: ~50 minutes.
- β = 80%: ~400 minutes.
4. **Thunderbird** (Green triangles):
- **Trend**: Steep upward slope.
- **Data Points**:
- β = 0%: ~200 minutes.
- β = 80%: ~1200 minutes.
---
## Spatial Grounding
- **Legend Position**: Top-right corner (standard placement for clarity).
- **Data Point Verification**:
- All markers (squares, circles, triangles) align with their respective legend entries.
- Colors match legend definitions (e.g., red circles = BGL).
---
## Trend Verification
- **HDFS**: Dominates with the steepest increase, suggesting high sensitivity to β.
- **Thunderbird**: Second-steepest slope, indicating moderate sensitivity.
- **Liberty**: Gradual increase, showing low sensitivity.
- **BGL**: Flattest slope, implying minimal impact from β changes.
---
## Notes
- No additional text, tables, or diagrams are present.
- All textual information is in **English**.
- No non-English content detected.
---
## Summary
The chart demonstrates that **HDFS** and **Thunderbird** exhibit the highest training time increases as β rises, while **BGL** remains relatively stable. This suggests β has a significant impact on training efficiency for HDFS and Thunderbird but not for BGL or Liberty.