## 3D Bar Chart: GPU Memory Usage vs. M and N
### Overview
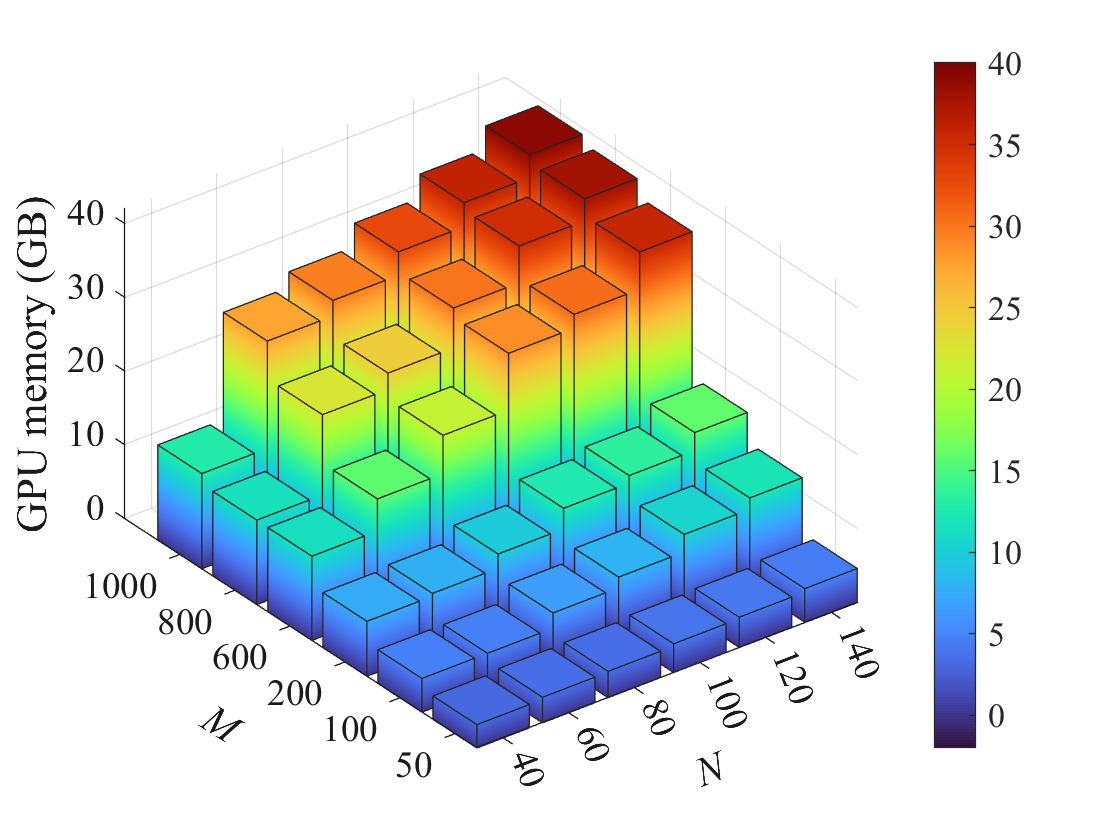
The image is a 3D bar chart visualizing GPU memory usage (in GB) as a function of two variables, M and N. The height and color of each bar represent the GPU memory usage for a specific combination of M and N values. The color gradient ranges from blue (low memory usage) to red (high memory usage).
### Components/Axes
* **Vertical Axis (GPU memory):** Labeled "GPU memory (GB)", with a scale from 0 to 40 GB, incrementing by 5 GB.
* **Horizontal Axis 1 (M):** Labeled "M", with values 50, 100, 200, 600, 800, and 1000.
* **Horizontal Axis 2 (N):** Labeled "N", with values 40, 60, 80, 100, 120, and 140.
* **Colorbar:** Located on the right side of the chart, indicating the GPU memory usage corresponding to each color. The colorbar ranges from blue (0 GB) to red (40 GB), with intermediate colors representing values in between.
### Detailed Analysis
The chart displays GPU memory usage for various combinations of M and N. The bars are arranged in a grid, with M increasing along one axis and N increasing along the other. The height and color of each bar indicate the GPU memory usage for that specific (M, N) combination.
Here's a breakdown of the approximate GPU memory usage based on the color and height of the bars:
* **Low Memory Usage (Blue):** The bars in the bottom-left corner (low M and N values) are blue, indicating low GPU memory usage, approximately between 0 and 10 GB. For example, at M=50 and N=40, the GPU memory usage is approximately 5 GB.
* **Medium Memory Usage (Green/Yellow):** As M and N increase, the bars become green and yellow, indicating medium GPU memory usage, approximately between 10 and 30 GB. For example, at M=600 and N=100, the GPU memory usage is approximately 20 GB.
* **High Memory Usage (Red):** The bars in the top-right corner (high M and N values) are red, indicating high GPU memory usage, approximately between 30 and 40 GB. For example, at M=1000 and N=140, the GPU memory usage is approximately 40 GB.
**Specific Data Points (Approximate):**
* M=50, N=40: ~5 GB
* M=100, N=60: ~7 GB
* M=200, N=80: ~12 GB
* M=600, N=100: ~20 GB
* M=800, N=120: ~30 GB
* M=1000, N=140: ~40 GB
**Trends:**
* **Increasing M:** For a fixed N, as M increases, GPU memory usage tends to increase.
* **Increasing N:** For a fixed M, as N increases, GPU memory usage tends to increase.
* **Overall:** The highest GPU memory usage occurs when both M and N are at their maximum values.
### Key Observations
* GPU memory usage is highly dependent on both M and N.
* The relationship between M, N, and GPU memory usage appears to be non-linear.
* The chart suggests a strong correlation between increasing M and N and increasing GPU memory consumption.
### Interpretation
The chart demonstrates how the parameters M and N affect GPU memory usage. The data suggests that increasing either M or N leads to higher GPU memory consumption, with the highest usage observed when both parameters are maximized. This information is crucial for optimizing code and resource allocation when working with GPUs, as it allows developers to understand the memory footprint of their applications and adjust parameters accordingly to avoid exceeding GPU memory limits. The non-linear relationship suggests that the memory usage might scale exponentially or according to a polynomial function of M and N.