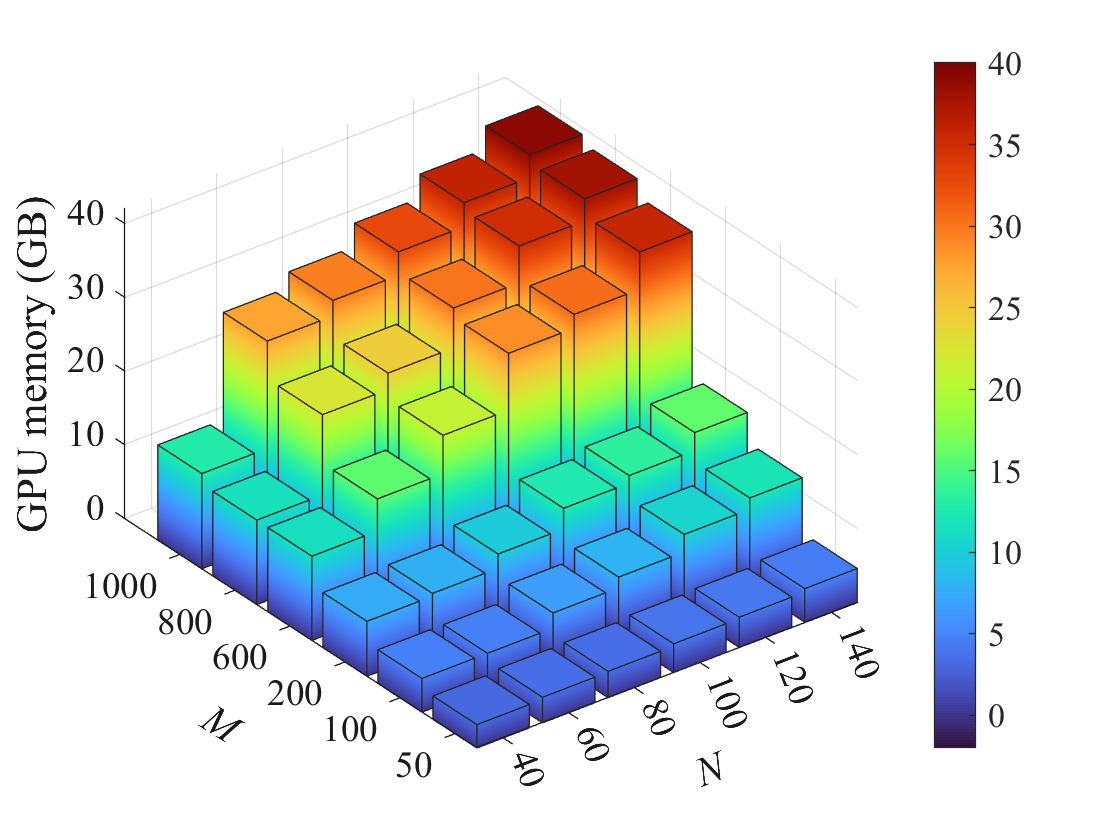
## 3D Surface Plot: GPU Memory Usage
### Overview
The image presents a 3D surface plot visualizing the relationship between two variables, *M* and *N*, and their impact on GPU memory usage. The plot displays GPU memory consumption in Gigabytes (GB) as a function of *M* and *N*. The surface is color-coded to represent the magnitude of GPU memory usage, with a color legend provided on the right side of the image.
### Components/Axes
* **X-axis:** *M*, ranging from approximately 40 to 1000.
* **Y-axis:** *N*, ranging from approximately 40 to 140.
* **Z-axis:** GPU memory (GB), ranging from approximately 0 to 40.
* **Color Legend:** A vertical color bar on the right side of the image, representing GPU memory usage in GB. The color gradient ranges from dark blue (0 GB) to dark red (40 GB). Specific values indicated on the legend are: 0, 5, 10, 15, 20, 25, 30, 35, and 40.
### Detailed Analysis
The surface plot shows a complex relationship between *M*, *N*, and GPU memory usage.
* **General Trend:** GPU memory usage generally increases as both *M* and *N* increase, but the relationship is not linear. There appears to be a peak in memory usage around *M* = 600 and *N* = 100.
* **Low *M* Values (40-200):** For low values of *M*, GPU memory usage increases with *N* up to a certain point (around *N* = 100), then plateaus or slightly decreases. The color of the surface is predominantly blue and green, indicating low memory usage (0-20 GB).
* **Medium *M* Values (200-600):** As *M* increases to the 200-600 range, the surface rises, and the color transitions to yellow and orange, indicating moderate memory usage (10-30 GB). The peak memory usage occurs within this range.
* **High *M* Values (600-1000):** For high values of *M*, the surface decreases in height, and the color shifts back towards green and blue, indicating decreasing memory usage.
* **Specific Data Points (Approximate):**
* At *M* = 40, *N* = 40, GPU memory ≈ 0 GB (dark blue).
* At *M* = 40, *N* = 140, GPU memory ≈ 5 GB (light blue).
* At *M* = 200, *N* = 40, GPU memory ≈ 5 GB (light blue).
* At *M* = 200, *N* = 140, GPU memory ≈ 15 GB (green).
* At *M* = 600, *N* = 100, GPU memory ≈ 35 GB (dark orange/red).
* At *M* = 1000, *N* = 40, GPU memory ≈ 10 GB (green).
* At *M* = 1000, *N* = 140, GPU memory ≈ 15 GB (green).
### Key Observations
* The plot exhibits a non-monotonic relationship between *M*, *N*, and GPU memory usage.
* The maximum GPU memory usage is approximately 35-40 GB, occurring around *M* = 600 and *N* = 100.
* GPU memory usage is relatively low for small values of *M* and *N*.
* There is a clear peak in memory usage, suggesting an optimal range for *M* and *N* to minimize memory consumption.
### Interpretation
This data likely represents the GPU memory requirements of a computational process or algorithm that depends on two parameters, *M* and *N*. The plot suggests that there is a sweet spot for these parameters where memory usage is minimized. Exceeding these values leads to increased memory consumption. The peak suggests a computational bottleneck or a phase transition in the algorithm's behavior.
The shape of the surface indicates that the relationship between the parameters and memory usage is complex and not simply additive. The algorithm may involve operations that scale differently with *M* and *N*, leading to the observed non-linear behavior. Understanding this relationship is crucial for optimizing the algorithm's performance and ensuring it can run efficiently on GPUs with limited memory. The plot could be used to guide the selection of appropriate values for *M* and *N* to balance computational efficiency and memory constraints.