## 3D Bar Chart: GPU Memory Consumption vs. Parameters M and N
### Overview
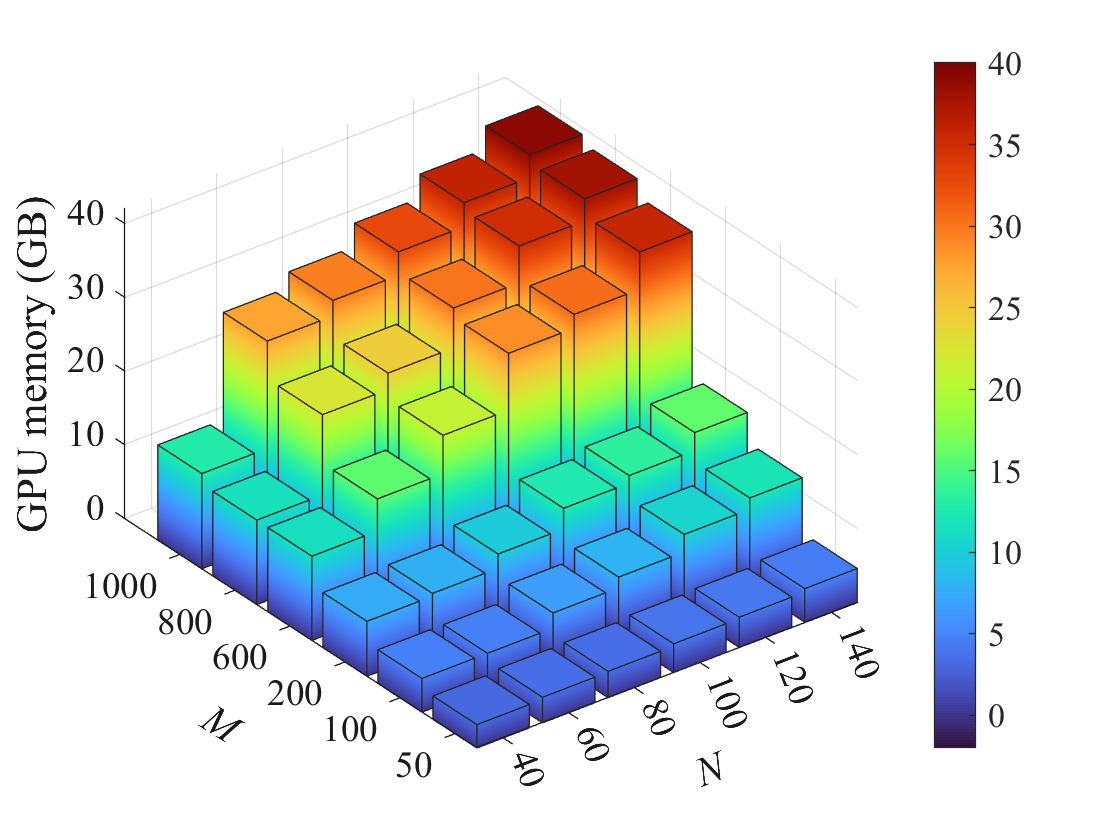
This image is a 3D bar chart visualizing the relationship between GPU memory consumption (in Gigabytes) and two independent variables, labeled **M** and **N**. The chart demonstrates how memory usage scales as these two parameters increase.
### Components/Axes
* **Vertical Axis (Z-axis):** Labeled **"GPU memory (GB)"**. The scale runs from 0 to 40, with major tick marks at 0, 10, 20, 30, and 40.
* **Left Horizontal Axis (X-axis):** Labeled **"M"**. The scale is non-linear, with marked values at 50, 100, 200, 600, 800, and 1000.
* **Right Horizontal Axis (Y-axis):** Labeled **"N"**. The scale is linear, with marked values at 40, 60, 80, 100, 120, and 140.
* **Color Bar/Legend:** Positioned on the far right of the image. It is a vertical gradient bar mapping color to the GPU memory value (GB). The scale runs from 0 (dark blue) to 40 (dark red), with labeled ticks at 0, 5, 10, 15, 20, 25, 30, 35, and 40. The color gradient progresses from dark blue -> light blue -> cyan -> green -> yellow -> orange -> red.
### Detailed Analysis
The chart displays a grid of 3D bars, where each bar's height and color correspond to the GPU memory value for a specific (M, N) pair.
**Trend Verification:**
* **Trend along M (holding N constant):** For any fixed value of N, moving from the front (M=50) to the back (M=1000) of the chart, the bars show a clear and significant upward slope. Memory consumption increases dramatically with M.
* **Trend along N (holding M constant):** For any fixed value of M, moving from the left (N=40) to the right (N=140) of the chart, the bars also show an upward slope, indicating increased memory consumption with N. The rate of increase appears less steep than for M.
**Data Point Extraction (Approximate Values):**
Values are estimated based on bar height relative to the Z-axis and color matching to the legend.
* **Lowest Memory Region (Front-Left Corner):**
* (M=50, N=40): ~1-2 GB (Dark Blue)
* (M=100, N=40): ~3-4 GB (Blue)
* **Moderate Memory Region (Center):**
* (M=200, N=80): ~10-12 GB (Cyan/Green)
* (M=600, N=100): ~20-22 GB (Yellow)
* **Highest Memory Region (Back-Right Corner):**
* (M=1000, N=140): ~38-40 GB (Dark Red). This is the peak value on the chart.
* (M=800, N=140): ~35-37 GB (Red-Orange)
* (M=1000, N=120): ~34-36 GB (Red-Orange)
**Spatial Grounding & Color Confirmation:**
The legend is positioned to the right of the main plot. The tallest bars, located in the back-right quadrant (high M, high N), are colored dark red, which corresponds to the top of the color bar (35-40 GB). The shortest bars in the front-left quadrant (low M, low N) are dark blue, matching the bottom of the color bar (0-5 GB). The color gradient across the bars consistently follows the trend of increasing height.
### Key Observations
1. **Exponential-like Growth:** The relationship between the parameters (M, N) and GPU memory is not linear. The increase in bar height accelerates as both M and N grow, suggesting a multiplicative or exponential scaling law.
2. **Dominant Parameter:** While memory increases with both variables, the growth with respect to **M** appears more pronounced. The step change in height from M=200 to M=600 is visually larger than the step from N=80 to N=120 for a comparable relative increase.
3. **Color as a Redundant Encoding:** The color gradient perfectly reinforces the height data, making high-memory regions immediately identifiable by their warm (red/orange) colors and low-memory regions by their cool (blue) colors.
### Interpretation
This chart likely illustrates the memory footprint of a computational process, such as training a machine learning model or running a large-scale simulation, where **M** and **N** represent key dimensions of the problem (e.g., batch size, sequence length, matrix dimensions, or number of features).
**What the data suggests:** GPU memory requirements scale poorly with the product of M and N. The system being measured has a high memory sensitivity to these parameters. The peak usage of nearly 40 GB indicates this process requires high-end GPU hardware with substantial VRAM.
**Why it matters:** For engineers or researchers, this visualization is crucial for resource planning. It answers: "If I need to increase my problem size (M and N), how much more GPU memory will I need?" It warns that doubling both M and N could lead to a more than fourfold increase in memory consumption, potentially causing out-of-memory errors if not planned for. The chart helps identify the operational "safe zone" (blue/green bars) versus the "high-resource zone" (orange/red bars).