## 3D Bar Chart: GPU Memory Allocation by M and N Parameters
### Overview
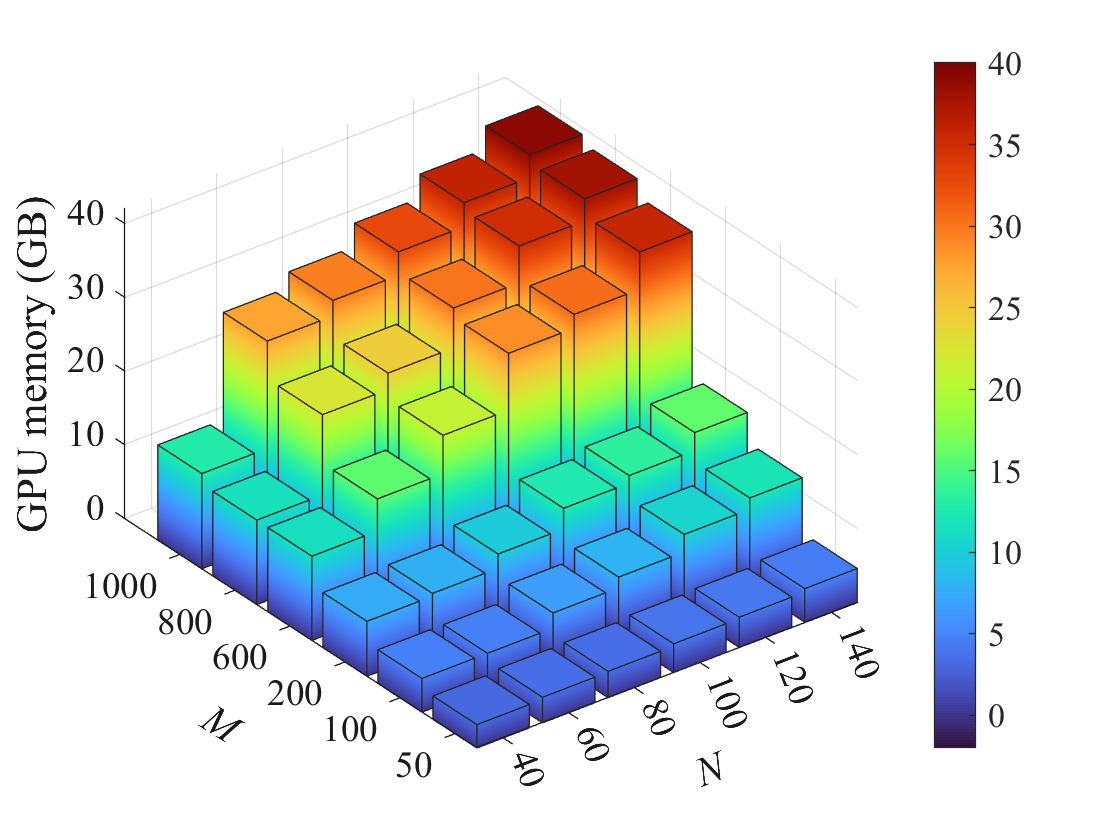
The image depicts a 3D bar chart visualizing GPU memory allocation (in GB) as a function of two parameters: M (horizontal axis, 100–1000) and N (depth axis, 40–140). The vertical axis represents GPU memory (0–40 GB), with a color gradient from blue (low memory) to red (high memory). The chart shows a clear trend of increasing GPU memory requirements as both M and N values rise.
### Components/Axes
- **X-axis (M)**: Labeled "M" with values ranging from 100 to 1000 in increments of 200.
- **Y-axis (N)**: Labeled "N" with values ranging from 40 to 140 in increments of 20.
- **Z-axis (GPU Memory)**: Labeled "GPU memory (GB)" with values from 0 to 40 in increments of 5.
- **Legend**: Positioned on the right, mapping colors to GPU memory values (blue = 0–5 GB, green = 5–15 GB, yellow = 15–25 GB, orange = 25–35 GB, red = 35–40 GB).
### Detailed Analysis
- **Bar Heights**:
- At M=100 and N=40, bars are blue (0–5 GB).
- At M=1000 and N=140, bars reach red (35–40 GB).
- Intermediate values (e.g., M=500, N=100) show green/yellow bars (~10–20 GB).
- **Color Gradient**:
- Blue dominates the lower-left corner (low M/N).
- Red dominates the upper-right corner (high M/N).
- **Trends**:
- GPU memory increases linearly with both M and N.
- The relationship appears multiplicative: higher M and N values compound memory requirements.
### Key Observations
1. **Maximum Allocation**: The tallest bars (red) at M=1000 and N=140 indicate a peak GPU memory requirement of ~40 GB.
2. **Minimum Allocation**: The shortest bars (blue) at M=100 and N=40 suggest near-zero memory usage (~0 GB).
3. **Scaling Pattern**: Memory requirements grow proportionally with M and N, with no visible saturation or non-linear thresholds in the observed range.
### Interpretation
The chart demonstrates that GPU memory allocation scales directly with both M and N parameters. This suggests:
- **Resource Planning**: Systems requiring large M and N values (e.g., high-resolution simulations or parallel processing tasks) must allocate ~40 GB of GPU memory.
- **Efficiency Trade-offs**: Lower M/N combinations (e.g., M=200, N=60) may suffice for less demanding workloads, using ~10–15 GB.
- **Predictability**: The linear relationship implies predictable scaling, useful for optimizing hardware procurement or cloud resource allocation.
No anomalies or outliers are observed; the data follows a consistent, monotonic trend. The chart likely represents a computational model where memory demands grow with task complexity (M) and parallelization degree (N).