## Heatmap: Classification Accuracies
### Overview
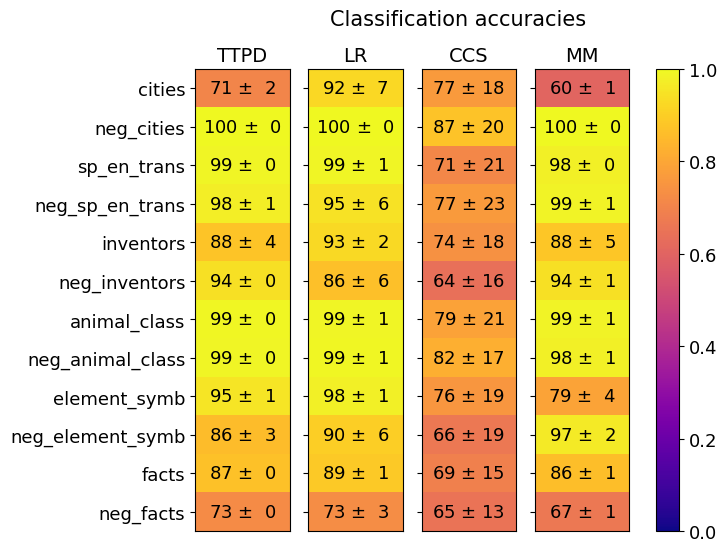
The image is a heatmap displaying classification accuracies for different categories using four different methods: TTPD, LR, CCS, and MM. The heatmap uses a color gradient from dark blue (0.0) to bright yellow (1.0) to represent the accuracy values. Each cell contains the accuracy value and its associated uncertainty (± value).
### Components/Axes
* **Title:** Classification accuracies
* **Columns (Methods):** TTPD, LR, CCS, MM
* **Rows (Categories):** cities, neg\_cities, sp\_en\_trans, neg\_sp\_en\_trans, inventors, neg\_inventors, animal\_class, neg\_animal\_class, element\_symb, neg\_element\_symb, facts, neg\_facts
* **Colorbar:** Ranges from 0.0 (dark blue) to 1.0 (bright yellow), representing classification accuracy.
### Detailed Analysis
Here's a breakdown of the data for each category and method:
* **cities:**
* TTPD: 71 ± 2
* LR: 92 ± 7
* CCS: 77 ± 18
* MM: 60 ± 1
* **neg\_cities:**
* TTPD: 100 ± 0
* LR: 100 ± 0
* CCS: 87 ± 20
* MM: 100 ± 0
* **sp\_en\_trans:**
* TTPD: 99 ± 0
* LR: 99 ± 1
* CCS: 71 ± 21
* MM: 98 ± 0
* **neg\_sp\_en\_trans:**
* TTPD: 98 ± 1
* LR: 95 ± 6
* CCS: 77 ± 23
* MM: 99 ± 1
* **inventors:**
* TTPD: 88 ± 4
* LR: 93 ± 2
* CCS: 74 ± 18
* MM: 88 ± 5
* **neg\_inventors:**
* TTPD: 94 ± 0
* LR: 86 ± 6
* CCS: 64 ± 16
* MM: 94 ± 1
* **animal\_class:**
* TTPD: 99 ± 0
* LR: 99 ± 1
* CCS: 79 ± 21
* MM: 99 ± 1
* **neg\_animal\_class:**
* TTPD: 99 ± 0
* LR: 99 ± 1
* CCS: 82 ± 17
* MM: 98 ± 1
* **element\_symb:**
* TTPD: 95 ± 1
* LR: 98 ± 1
* CCS: 76 ± 19
* MM: 79 ± 4
* **neg\_element\_symb:**
* TTPD: 86 ± 3
* LR: 90 ± 6
* CCS: 66 ± 19
* MM: 97 ± 2
* **facts:**
* TTPD: 87 ± 0
* LR: 89 ± 1
* CCS: 69 ± 15
* MM: 86 ± 1
* **neg\_facts:**
* TTPD: 73 ± 0
* LR: 73 ± 3
* CCS: 65 ± 13
* MM: 67 ± 1
### Key Observations
* LR and TTPD generally have higher accuracy scores compared to CCS.
* MM performs well, often close to LR and TTPD.
* CCS has the largest uncertainty (± values) in its accuracy scores.
* For "neg\_cities", all methods except CCS achieve 100% accuracy.
* The "cities" category shows the largest variation in accuracy across the four methods.
### Interpretation
The heatmap visualizes the performance of four different classification methods across twelve categories. The color gradient allows for a quick comparison of accuracy scores. The data suggests that LR and TTPD are generally more accurate than CCS, while MM provides competitive results. The high uncertainty associated with CCS indicates that its performance may be less consistent. The perfect accuracy achieved by multiple methods for "neg\_cities" suggests that this category is relatively easy to classify. The variation in accuracy for "cities" indicates that this category may be more challenging.