## Heatmap: Classification Accuracies
### Overview
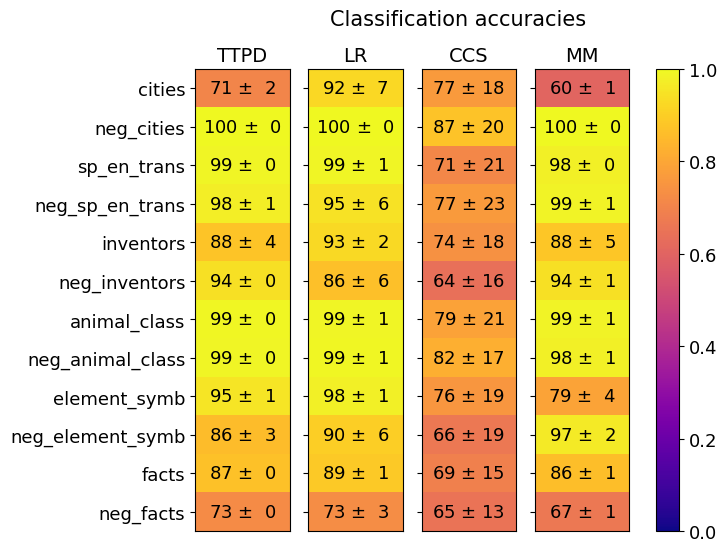
The image is a heatmap visualizing classification accuracy across four machine learning models (TTPD, LR, CCS, MM) for 12 distinct categories. Accuracy values are presented with uncertainty (±σ), and colors range from purple (0.0) to yellow (1.0) based on a gradient scale.
### Components/Axes
- **X-axis (Models)**: TTPD, LR, CCS, MM (left to right)
- **Y-axis (Categories)**:
1. cities
2. neg_cities
3. sp_en_trans
4. neg_sp_en_trans
5. inventors
6. neg_inventors
7. animal_class
8. neg_animal_class
9. element_symbol
10. neg_element_symbol
11. facts
12. neg_facts
- **Legend**: Vertical color bar on the right (0.0 = purple, 1.0 = yellow)
- **Title**: "Classification accuracies" at the top center
### Detailed Analysis
#### Data Table Reconstruction
| Category | TTPD | LR | CCS | MM |
|------------------------|------------|------------|-------------|------------|
| cities | 71 ± 2 | 92 ± 7 | 77 ± 18 | 60 ± 1 |
| neg_cities | 100 ± 0 | 100 ± 0 | 87 ± 20 | 100 ± 0 |
| sp_en_trans | 99 ± 0 | 99 ± 1 | 71 ± 21 | 98 ± 0 |
| neg_sp_en_trans | 98 ± 1 | 95 ± 6 | 77 ± 23 | 99 ± 1 |
| inventors | 88 ± 4 | 93 ± 2 | 74 ± 18 | 88 ± 5 |
| neg_inventors | 94 ± 0 | 86 ± 6 | 64 ± 16 | 94 ± 1 |
| animal_class | 99 ± 0 | 99 ± 1 | 79 ± 21 | 99 ± 1 |
| neg_animal_class | 99 ± 0 | 99 ± 1 | 82 ± 17 | 98 ± 1 |
| element_symbol | 95 ± 1 | 98 ± 1 | 76 ± 19 | 79 ± 4 |
| neg_element_symbol | 86 ± 3 | 90 ± 6 | 66 ± 19 | 97 ± 2 |
| facts | 87 ± 0 | 89 ± 1 | 69 ± 15 | 86 ± 1 |
| neg_facts | 73 ± 0 | 73 ± 3 | 65 ± 13 | 67 ± 1 |
#### Spatial Grounding
- **Legend**: Right-aligned vertical color bar (0.0–1.0)
- **Title**: Centered at the top
- **Axes**:
- X-axis labels (models) at the top
- Y-axis labels (categories) on the left
- **Cell Colors**: Match legend gradient (e.g., 71 ± 2 = reddish-orange, 100 ± 0 = bright yellow)
### Key Observations
1. **Model Performance**:
- **LR (Logistic Regression)** and **MM (Meta-Models)** consistently achieve the highest accuracies (90–100%).
- **CCS** underperforms in most categories (64–87%), with significant uncertainty (±13–23).
- **TTPD** shows moderate performance (67–95%) with lower uncertainty (±0–7).
2. **Category Trends**:
- **neg_* categories** (e.g., neg_cities, neg_inventors) achieve near-perfect accuracy (94–100%) across models, suggesting easier classification for negative classes.
- **element_symbol** and **neg_element_symbol** show high variability (76–98%), with CCS struggling most (±19).
- **facts** and **neg_facts** have the lowest accuracies (65–89%), particularly for CCS (±13–15).
3. **Uncertainty Patterns**:
- CCS exhibits the highest uncertainty (e.g., 77 ± 23 for sp_en_trans).
- LR and MM demonstrate the lowest uncertainty (e.g., 100 ± 0 for neg_cities).
### Interpretation
The data suggests:
- **LR and MM** are robust models with high accuracy and low variability, likely due to their simplicity (LR) or ensemble approaches (MM).
- **CCS** struggles with complex or imbalanced categories (e.g., neg_inventors, neg_facts), possibly due to overfitting or insufficient feature representation.
- **neg_* categories** are consistently easier to classify, indicating potential class imbalance or distinct separability in negative classes.
- The **element_symbol** and **facts** categories show the greatest model divergence, highlighting challenges in symbolic or factual reasoning.
This heatmap underscores the importance of model selection based on task complexity and data characteristics, with LR/MM being preferable for high-stakes applications requiring reliability.