## Line Chart: Throughput vs. Hidden Size
### Overview
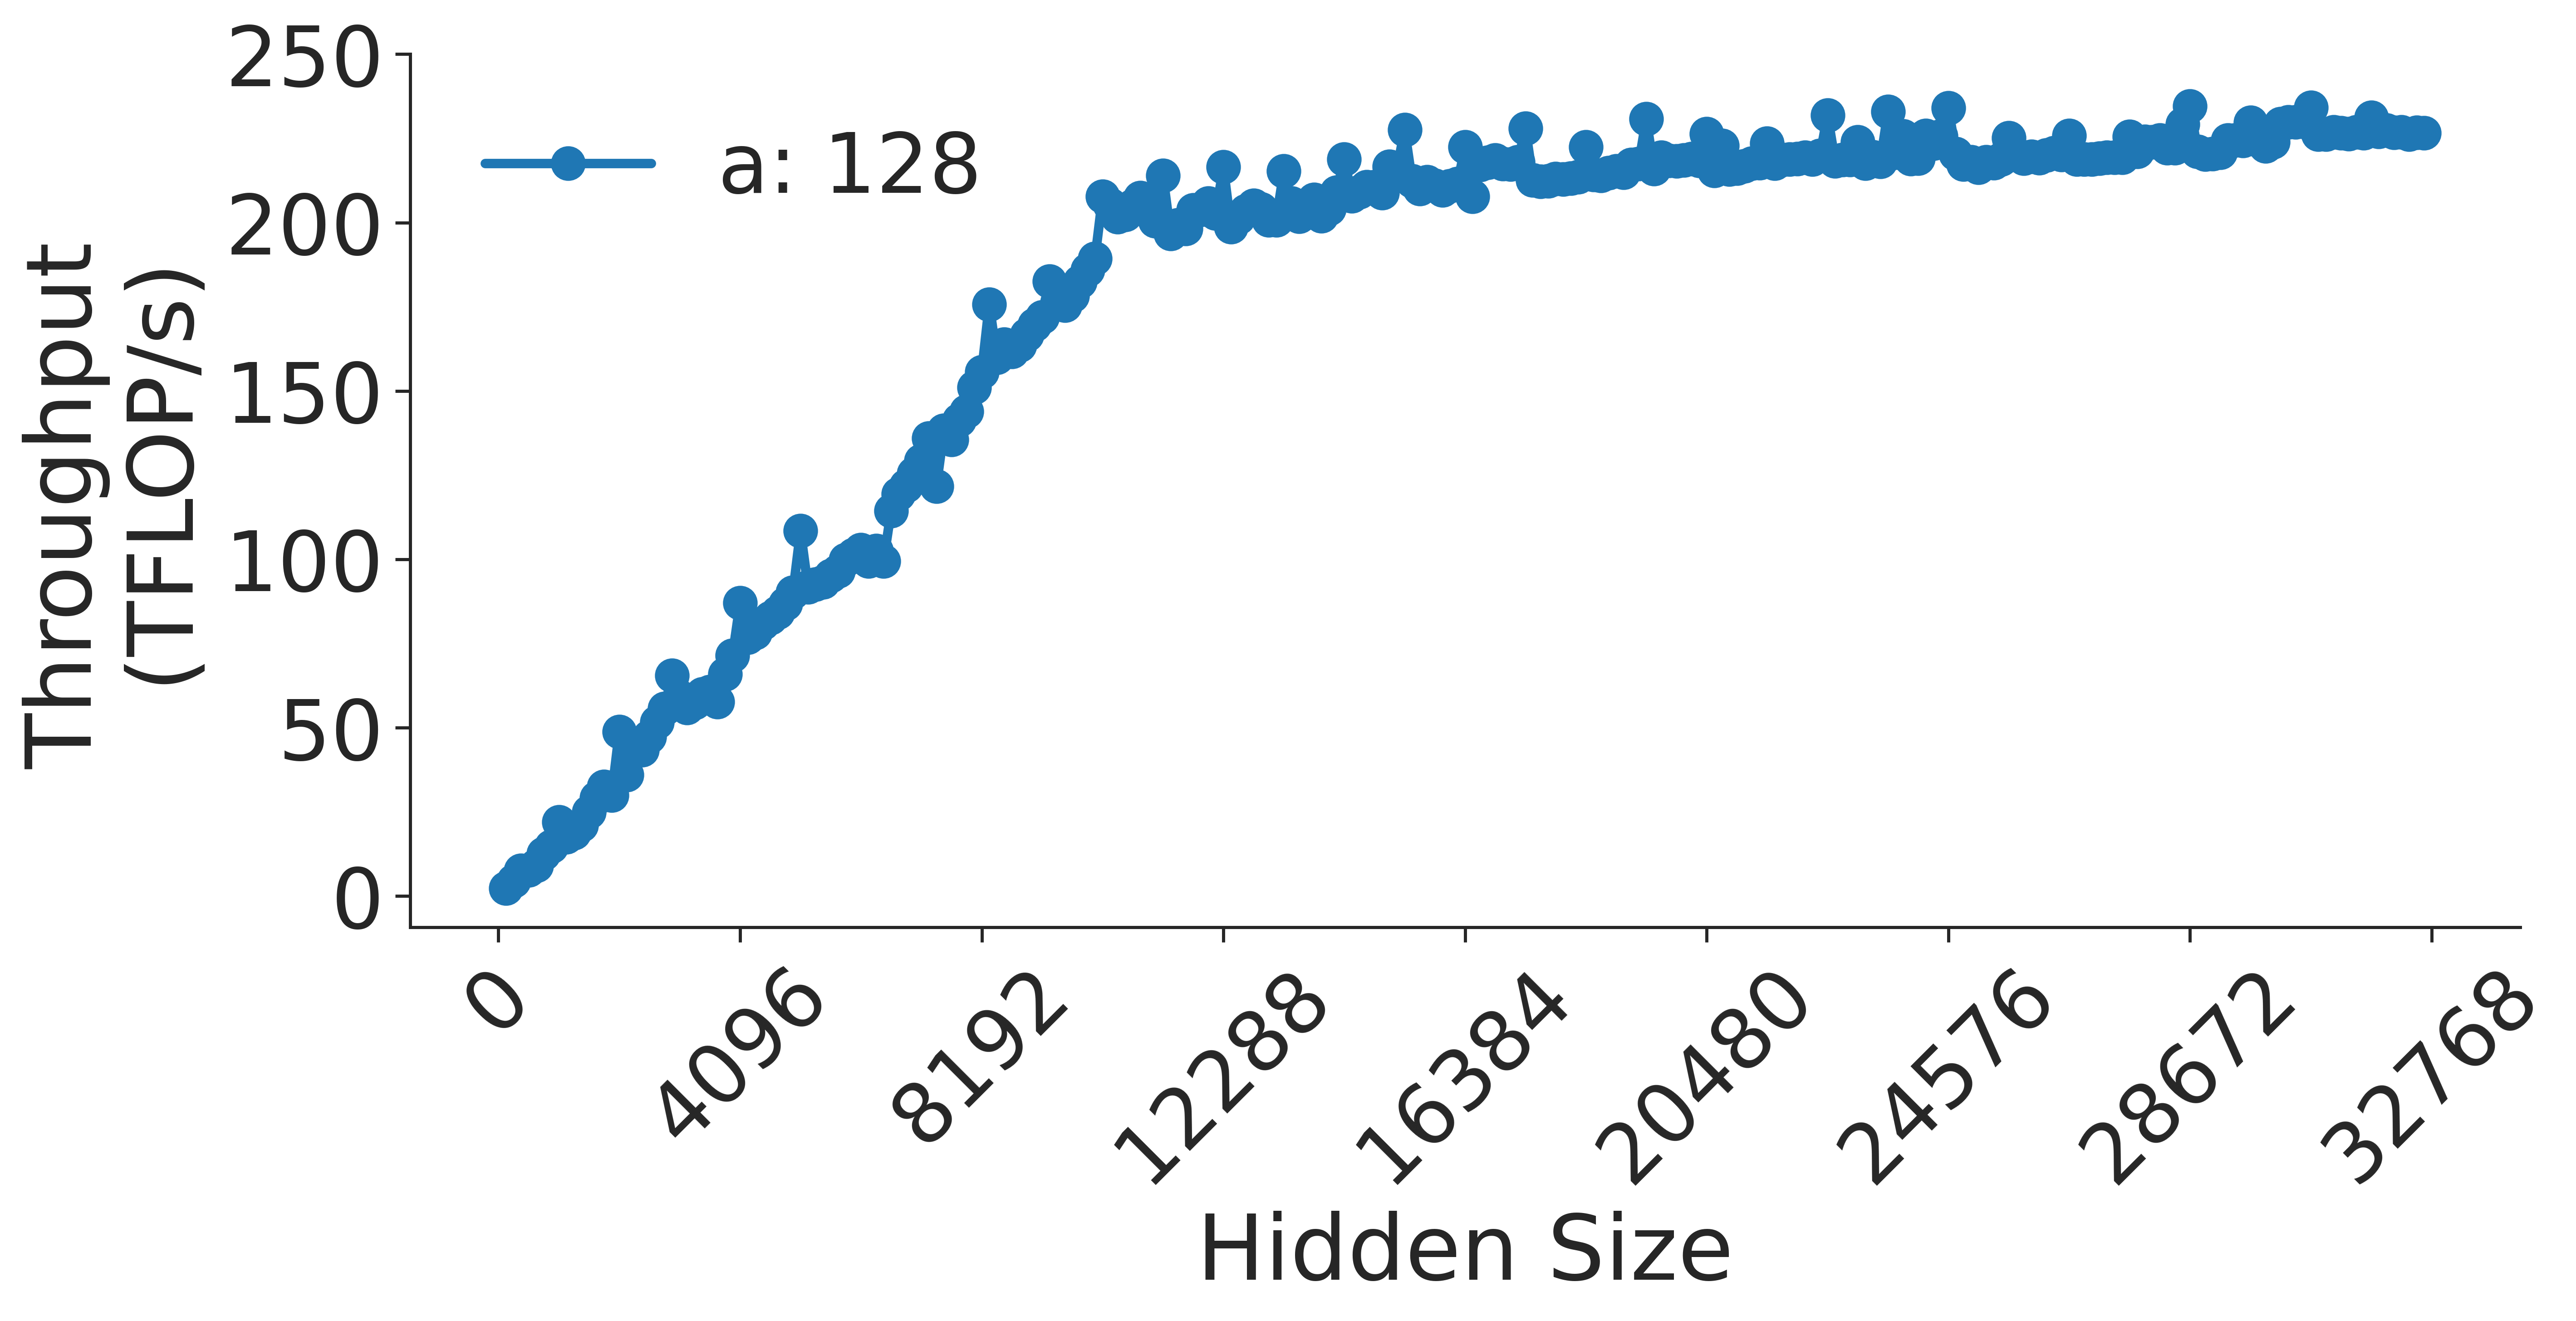
This image displays a performance benchmark chart illustrating the relationship between "Hidden Size" (likely a parameter of a neural network layer) and "Throughput" measured in TFLOP/s (Tera Floating Point Operations per second). The chart shows a single data series, labeled "a: 128," which exhibits a characteristic "knee" curve, indicating an initial linear growth phase followed by a saturation phase.
### Components/Axes
* **Y-Axis (Vertical):** Labeled "Throughput (TFLOP/s)". The scale ranges from 0 to 250, with major tick marks at intervals of 50.
* **X-Axis (Horizontal):** Labeled "Hidden Size". The scale ranges from 0 to 32,768, with major tick marks at 0, 4096, 8192, 12288, 16384, 20480, 24576, 28672, and 32768.
* **Legend:** Located in the top-left corner. It displays a blue line with a circular marker next to the text "a: 128".
* **Data Series:** A single blue line connecting circular data points, representing the performance metrics for the configuration "a: 128".
### Detailed Analysis
The data series follows a distinct three-phase trend:
1. **Linear Growth Phase (Hidden Size 0 to ~10,000):**
* The line starts at the origin (0, 0).
* It slopes upward steeply and consistently.
* At Hidden Size ~4,096, the throughput is approximately 60–70 TFLOP/s.
* **Anomaly:** There is a notable, sharp upward spike at a Hidden Size of approximately 5,000, where throughput jumps to roughly 110 TFLOP/s before returning to the trend line.
* At Hidden Size ~8,192, the throughput reaches approximately 160 TFLOP/s.
2. **Transition/Knee Phase (Hidden Size ~10,000 to ~14,000):**
* The slope begins to flatten significantly.
* At Hidden Size ~12,288, the throughput is approximately 200 TFLOP/s.
3. **Saturation Phase (Hidden Size ~14,000 to 32,768):**
* The curve enters a plateau. The rate of increase slows drastically, indicating diminishing returns on throughput as the Hidden Size increases.
* At Hidden Size ~16,384, the throughput is approximately 210–215 TFLOP/s.
* At the maximum Hidden Size of 32,768, the throughput reaches approximately 230 TFLOP/s.
### Key Observations
* **Saturation Point:** The system reaches near-peak performance (the "knee") at a Hidden Size of approximately 12,000 to 14,000. Beyond this point, increasing the Hidden Size yields minimal gains in throughput.
* **Outlier:** The spike at ~5,000 Hidden Size is an anomaly. It suggests a potential non-linear behavior in the underlying hardware or software kernel execution at that specific parameter size (possibly related to cache alignment or memory access patterns).
* **Consistency:** Despite the saturation, the line maintains a very slight, positive upward drift, suggesting that while the system is largely saturated, it is not strictly capped at a hard limit.
### Interpretation
This chart demonstrates the efficiency scaling of a computational workload (likely a matrix multiplication or neural network layer) on hardware.
* **Efficiency Scaling:** The initial linear phase represents the "compute-bound" or "memory-latency-bound" region where increasing the workload size directly improves hardware utilization.
* **Saturation:** The plateau indicates that the hardware has reached its peak operational capacity (likely memory bandwidth or compute unit saturation).
* **Technical Insight:** The "a: 128" label likely refers to a batch size or a specific kernel configuration. The data suggests that for this specific configuration, there is little benefit to increasing the "Hidden Size" beyond ~14,000, as the throughput gains become negligible compared to the increased memory/compute requirements. The outlier at ~5,000 is a "micro-optimization" artifact—a specific point where the workload size perfectly aligns with the hardware's cache or register file architecture, allowing for a temporary burst in efficiency.