# Technical Analysis of Venn Diagrams Comparing Tool Overlaps
## Diagram Structure
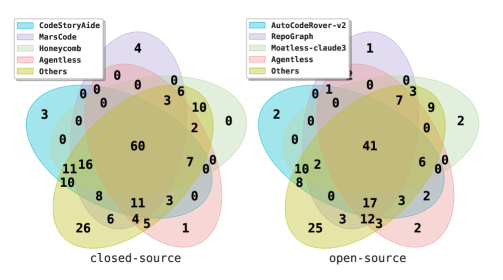
The image contains two Venn diagrams comparing tool overlaps in **closed-source** (left) and **open-source** (right) environments. Each diagram uses overlapping circles to represent tool intersections, with numerical values indicating counts in specific regions.
---
## Closed-Source Diagram
### Legend
- **CodeStoryAide**: Blue
- **MarsCode**: Purple
- **Honeycomb**: Light Green
- **Agentless**: Pink
- **Others**: Yellow
### Key Data Points
1. **Central Overlap (All Tools)**: 60
2. **Pairwise Overlaps**:
- CodeStoryAide & MarsCode: 0
- CodeStoryAide & Honeycomb: 11
- CodeStoryAide & Agentless: 16
- MarsCode & Honeycomb: 7
- MarsCode & Agentless: 0
- Honeycomb & Agentless: 5
3. **Individual Sections**:
- CodeStoryAide: 3
- MarsCode: 4
- Honeycomb: 10
- Agentless: 1
- Others: 26
---
## Open-Source Diagram
### Legend
- **AutoCodeRover-v2**: Blue
- **RepoGraph**: Purple
- **Moatless-claude3**: Light Green
- **Agentless**: Pink
- **Others**: Yellow
### Key Data Points
1. **Central Overlap (All Tools)**: 41
2. **Pairwise Overlaps**:
- AutoCodeRover-v2 & RepoGraph: 1
- AutoCodeRover-v2 & Moatless-claude3: 2
- AutoCodeRover-v2 & Agentless: 0
- RepoGraph & Moatless-claude3: 3
- RepoGraph & Agentless: 2
- Moatless-claude3 & Agentless: 12
3. **Individual Sections**:
- AutoCodeRover-v2: 2
- RepoGraph: 7
- Moatless-claude3: 9
- Agentless: 2
- Others: 25
---
## Observations
1. **Agentless** appears in both diagrams but with minimal individual counts (1 in closed-source, 2 in open-source).
2. **Honeycomb** (closed-source) and **Moatless-claude3** (open-source) show significant pairwise overlaps (11 and 9, respectively).
3. The central overlap is larger in the closed-source diagram (60 vs. 41 in open-source).
4. **Others** categories dominate both diagrams (26 in closed-source, 25 in open-source).