# Technical Document Extraction: Flowchart Analysis
## Diagram Overview
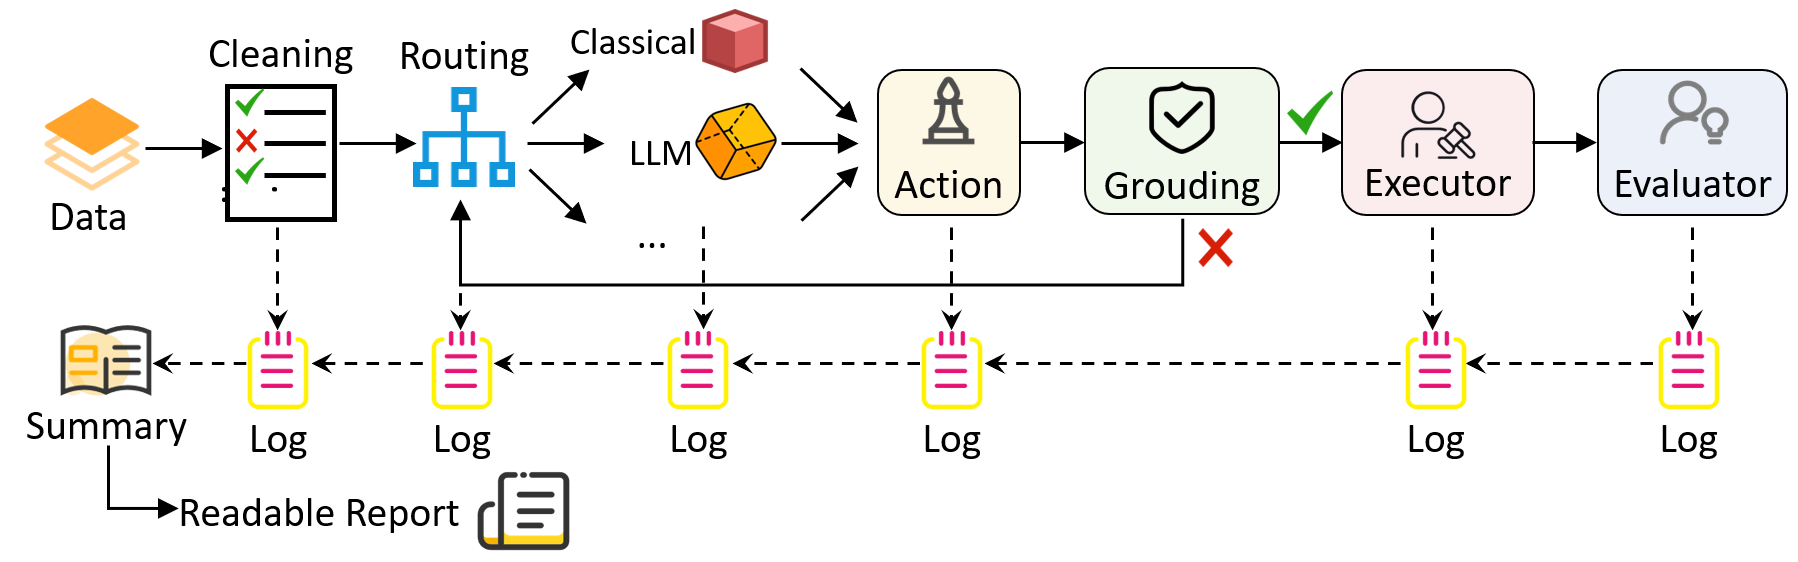
The image depicts a **process flowchart** for a data processing system. It illustrates the flow of data through multiple stages, decision points, and outputs. The diagram uses color-coded paths and labeled components to represent the system's architecture.
---
## Key Components and Flow
### 1. **Data Input**
- **Component**: `Data` (orange icon)
- **Flow**:
- Enters the system at the leftmost node.
- Connects directly to the `Cleaning` stage.
### 2. **Cleaning Stage**
- **Component**: `Cleaning` (black box with checkmark ✅ and cross ❌)
- **Function**:
- Processes raw data.
- Outputs a **Summary** (book icon) and a **Log** (yellow notepad).
- **Flow**:
- Dashed arrow to `Summary`.
- Solid arrow to `Routing`.
### 3. **Routing Stage**
- **Component**: `Routing` (blue diamond)
- **Function**:
- Splits data into two paths:
- **Classical Path** (red cube icon).
- **LLM Path** (orange polyhedron icon).
- **Flow**:
- Dashed arrows to both paths.
- Converges into `Action` via solid arrows.
### 4. **Decision Paths**
#### a. **Classical Path**
- **Component**: `Classical` (red cube)
- **Flow**:
- Directly connects to `Action`.
#### b. **LLM Path**
- **Component**: `LLM` (orange polyhedron)
- **Flow**:
- Directly connects to `Action`.
### 5. **Action Stage**
- **Component**: `Action` (tower icon)
- **Function**:
- Processes outputs from both paths.
- **Flow**:
- Solid arrow to `Grouping`.
### 6. **Grouping Stage**
- **Component**: `Grouping` (shield icon with ✅)
- **Function**:
- Validates or groups processed data.
- **Flow**:
- Solid arrow to `Executor`.
- Dashed arrow to `Log`.
### 7. **Executor Stage**
- **Component**: `Executor` (person with hammer icon)
- **Function**:
- Executes actions based on grouped data.
- **Flow**:
- Solid arrow to `Evaluator`.
- Dashed arrow to `Log`.
### 8. **Evaluator Stage**
- **Component**: `Evaluator` (person with lightbulb icon)
- **Function**:
- Evaluates outcomes.
- **Flow**:
- Solid arrow to `Log`.
---
## Outputs
1. **Summary**:
- Generated from the `Cleaning` stage.
- Represented by a book icon.
2. **Logs**:
- Produced at every stage (`Cleaning`, `Routing`, `Action`, `Grouping`, `Executor`, `Evaluator`).
- Represented by yellow notepads with red lines.
3. **Readable Report**:
- Final output derived from the `Summary`.
- Represented by a document icon.
---
## Color Coding Legend
- **Blue**: Routing stage and classical path.
- **Orange**: LLM path.
- **Red**: Cross (invalid data) and classical path icon.
- **Yellow**: Logs.
- **Green**: Checkmark (valid data) and grouping stage.
---
## Spatial Grounding
- **X-axis**: Left-to-right progression of data flow.
- **Y-axis**: Vertical alignment of components (e.g., `Cleaning` above `Routing`).
- **Legend Position**: Implicitly defined by color associations (no explicit legend box).
---
## Notes
- **No Numerical Data**: The diagram represents a process flow, not quantitative trends.
- **Dashed Arrows**: Indicate auxiliary outputs (e.g., logs).
- **Solid Arrows**: Represent primary data flow.
---
## Conclusion
This flowchart outlines a multi-stage data processing system with parallel paths (classical vs. LLM), validation checkpoints, and iterative logging. The system emphasizes modularity, with each component handling specific tasks before passing data to the next stage.