\n
## Diagram: Knowledge Distillation Neural Network Architecture
### Overview
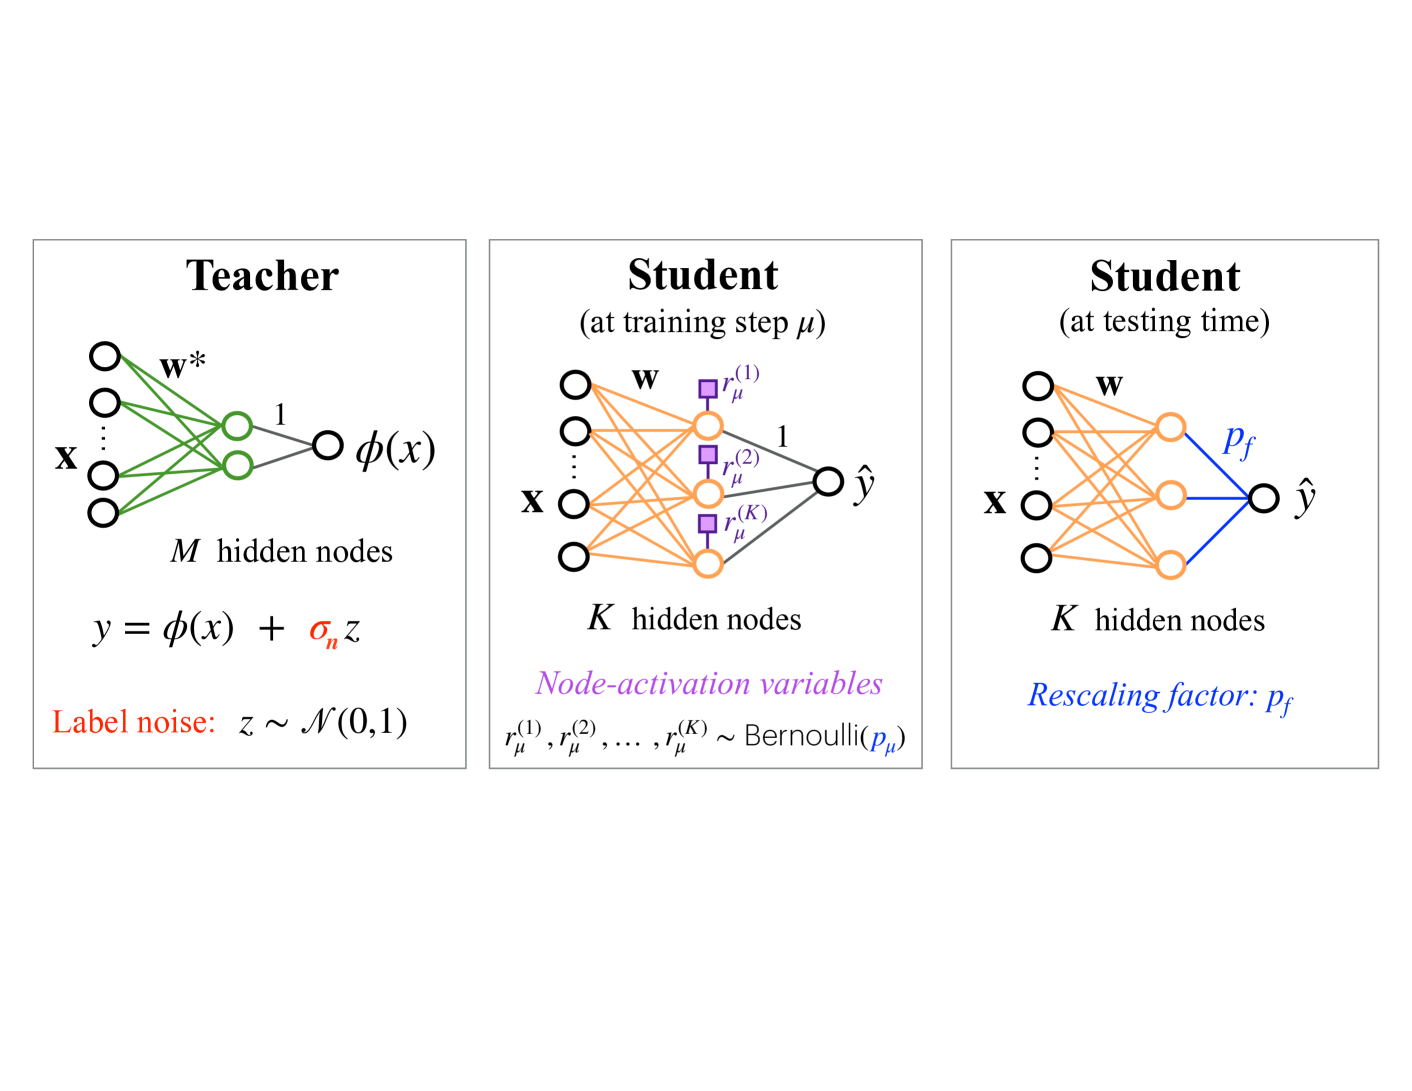
The image depicts a diagram illustrating the architecture of a knowledge distillation process, comparing a "Teacher" neural network to a "Student" network during training and testing phases. The diagram shows the flow of information through these networks, highlighting key components and parameters.
### Components/Axes
The diagram is divided into three main sections, arranged horizontally: "Teacher", "Student (at training step μ)", and "Student (at testing time)". Each section represents a neural network with input 'x' and output 'ŷ'.
* **Teacher Network:**
* Input: x
* Hidden Layers: M hidden nodes, represented by green circles.
* Weights: w\*
* Output: y = φ(x) + σ<sub>y</sub>z
* Label Noise: z ~ N(0,1)
* **Student Network (Training):**
* Input: x
* Hidden Layers: K hidden nodes, represented by white circles.
* Weights: w
* Node-activation variables: r<sub>μ</sub><sup>(1)</sup>, r<sub>μ</sub><sup>(2)</sup>, r<sub>μ</sub><sup>(K)</sup> ~ Bernoulli(p<sub>μ</sub>)
* Output: ŷ
* **Student Network (Testing):**
* Input: x
* Hidden Layers: K hidden nodes, represented by white circles.
* Weights: w
* Rescaling factor: Pf
* Output: ŷ
### Detailed Analysis / Content Details
The diagram illustrates the flow of information through each network.
* **Teacher Network:** The input 'x' is processed through M hidden nodes, represented by green circles, with weights w\*. The output 'y' is calculated as φ(x) plus a noise term, where the noise 'z' follows a normal distribution with mean 0 and standard deviation σ<sub>y</sub>.
* **Student Network (Training):** The input 'x' is processed through K hidden nodes, represented by white circles, with weights 'w'. Node-activation variables r<sub>μ</sub><sup>(1)</sup>, r<sub>μ</sub><sup>(2)</sup>, r<sub>μ</sub><sup>(K)</sup> are sampled from a Bernoulli distribution with parameter p<sub>μ</sub>. The output is ŷ.
* **Student Network (Testing):** The input 'x' is processed through K hidden nodes, represented by white circles, with weights 'w'. The output is rescaled by a factor 'Pf' to produce ŷ.
The connections between nodes are represented by arrows. The Teacher network has a single output arrow, while the Student networks have multiple arrows representing the activation variables. The Student network during training has square nodes highlighted in purple, indicating the Bernoulli sampling process.
### Key Observations
* The Teacher network introduces label noise (z) during the learning process.
* The Student network utilizes node-activation variables (r<sub>μ</sub><sup>(k)</sup>) during training, sampled from a Bernoulli distribution.
* A rescaling factor (Pf) is applied to the Student network's output during testing.
* The number of hidden nodes differs between the Teacher (M) and Student (K) networks.
### Interpretation
This diagram illustrates the process of knowledge distillation, where a smaller "Student" network learns to mimic the behavior of a larger, more complex "Teacher" network. The Teacher network, potentially pre-trained, provides a soft target for the Student network to learn from. The introduction of label noise in the Teacher network and the use of node-activation variables in the Student network during training are techniques used to improve the Student's generalization ability. The rescaling factor (Pf) during testing likely adjusts the Student's output to better match the Teacher's output distribution.
The diagram suggests that the Student network aims to approximate the function learned by the Teacher network, but with a potentially different architecture (K hidden nodes vs. M hidden nodes). The Bernoulli sampling and rescaling factor are key components of the distillation process, allowing the Student to learn from the Teacher's soft targets and improve its performance. The diagram is a conceptual representation of the process and does not provide specific numerical values or performance metrics.