## Diagram: Graph Representations and Adjacency Matrices
### Overview
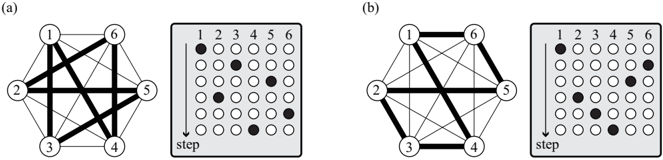
The image presents two graph diagrams, labeled (a) and (b), each accompanied by an adjacency matrix representation. The graphs consist of six nodes (numbered 1 to 6) connected by edges of varying thickness, indicating different weights or strengths of connection. The adjacency matrices use filled circles to represent the presence of an edge between two nodes. The "step" label with a downward arrow suggests a sequential process or state transition.
### Components/Axes
* **Nodes:** Numbered 1 through 6 in each graph.
* **Edges:** Lines connecting the nodes, with varying thickness.
* **Adjacency Matrices:** 6x6 grids representing the connections between nodes. Rows and columns are labeled 1 through 6. Filled circles indicate the presence of an edge.
* **Step Indicator:** A downward arrow labeled "step" next to each matrix.
### Detailed Analysis
**Diagram (a):**
* **Graph:**
* Nodes 1-6 are arranged in a hexagon.
* Thick edges connect:
* 1 and 2
* 2 and 3
* 3 and 4
* 4 and 5
* 5 and 6
* 6 and 1
* 2 and 5
* 1 and 4
* Thin edges connect:
* 1 and 3
* 1 and 5
* 2 and 4
* 2 and 6
* 3 and 5
* 3 and 6
* 4 and 6
* **Adjacency Matrix:**
* Row 1: Filled circle in column 1, column 2, and column 4.
* Row 2: Filled circle in column 2, column 1, column 3, and column 5.
* Row 3: Filled circle in column 3, column 2, and column 4.
* Row 4: Filled circle in column 4, column 1, column 3, and column 5.
* Row 5: Filled circle in column 5, column 2, column 4, and column 6.
* Row 6: Filled circle in column 6, column 5.
**Diagram (b):**
* **Graph:**
* Nodes 1-6 are arranged in a hexagon.
* Thick edges connect:
* 1 and 6
* 2 and 5
* 3 and 4
* Thin edges connect:
* 1 and 2
* 1 and 3
* 1 and 4
* 1 and 5
* 2 and 3
* 2 and 4
* 2 and 6
* 3 and 5
* 3 and 6
* 4 and 5
* 4 and 6
* 5 and 6
* **Adjacency Matrix:**
* Row 1: Filled circle in column 1 and column 6.
* Row 2: Filled circle in column 2 and column 5.
* Row 3: Filled circle in column 3 and column 4.
* Row 4: Filled circle in column 4 and column 3.
* Row 5: Filled circle in column 5 and column 2, and column 6.
* Row 6: Filled circle in column 6, column 1, and column 5.
### Key Observations
* The thick edges in the graphs correspond to filled circles in the adjacency matrices.
* The "step" indicator suggests a transition from the graph in (a) to the graph in (b).
* The adjacency matrices are symmetric, indicating undirected graphs.
* The diagonal elements of the adjacency matrices are filled in row 1, row 2, row 3, row 4, and row 5 in diagram (a), and in row 1, row 2, row 3 in diagram (b), indicating self-loops.
### Interpretation
The image illustrates the relationship between graph representations and adjacency matrices. The graphs visually depict connections between nodes, while the adjacency matrices provide a numerical representation of these connections. The varying thickness of the edges could represent different weights or strengths of the connections. The "step" indicator suggests a transformation or evolution of the graph structure over time or through a process. The change from graph (a) to graph (b) shows a shift in the primary connections between nodes, potentially representing a change in the system being modeled. The adjacency matrices provide a way to quantify and analyze these changes. The self-loops in diagram (a) and diagram (b) indicate that some nodes are connected to themselves.