\n
## Diagram: Proof Generation and Verification
### Overview
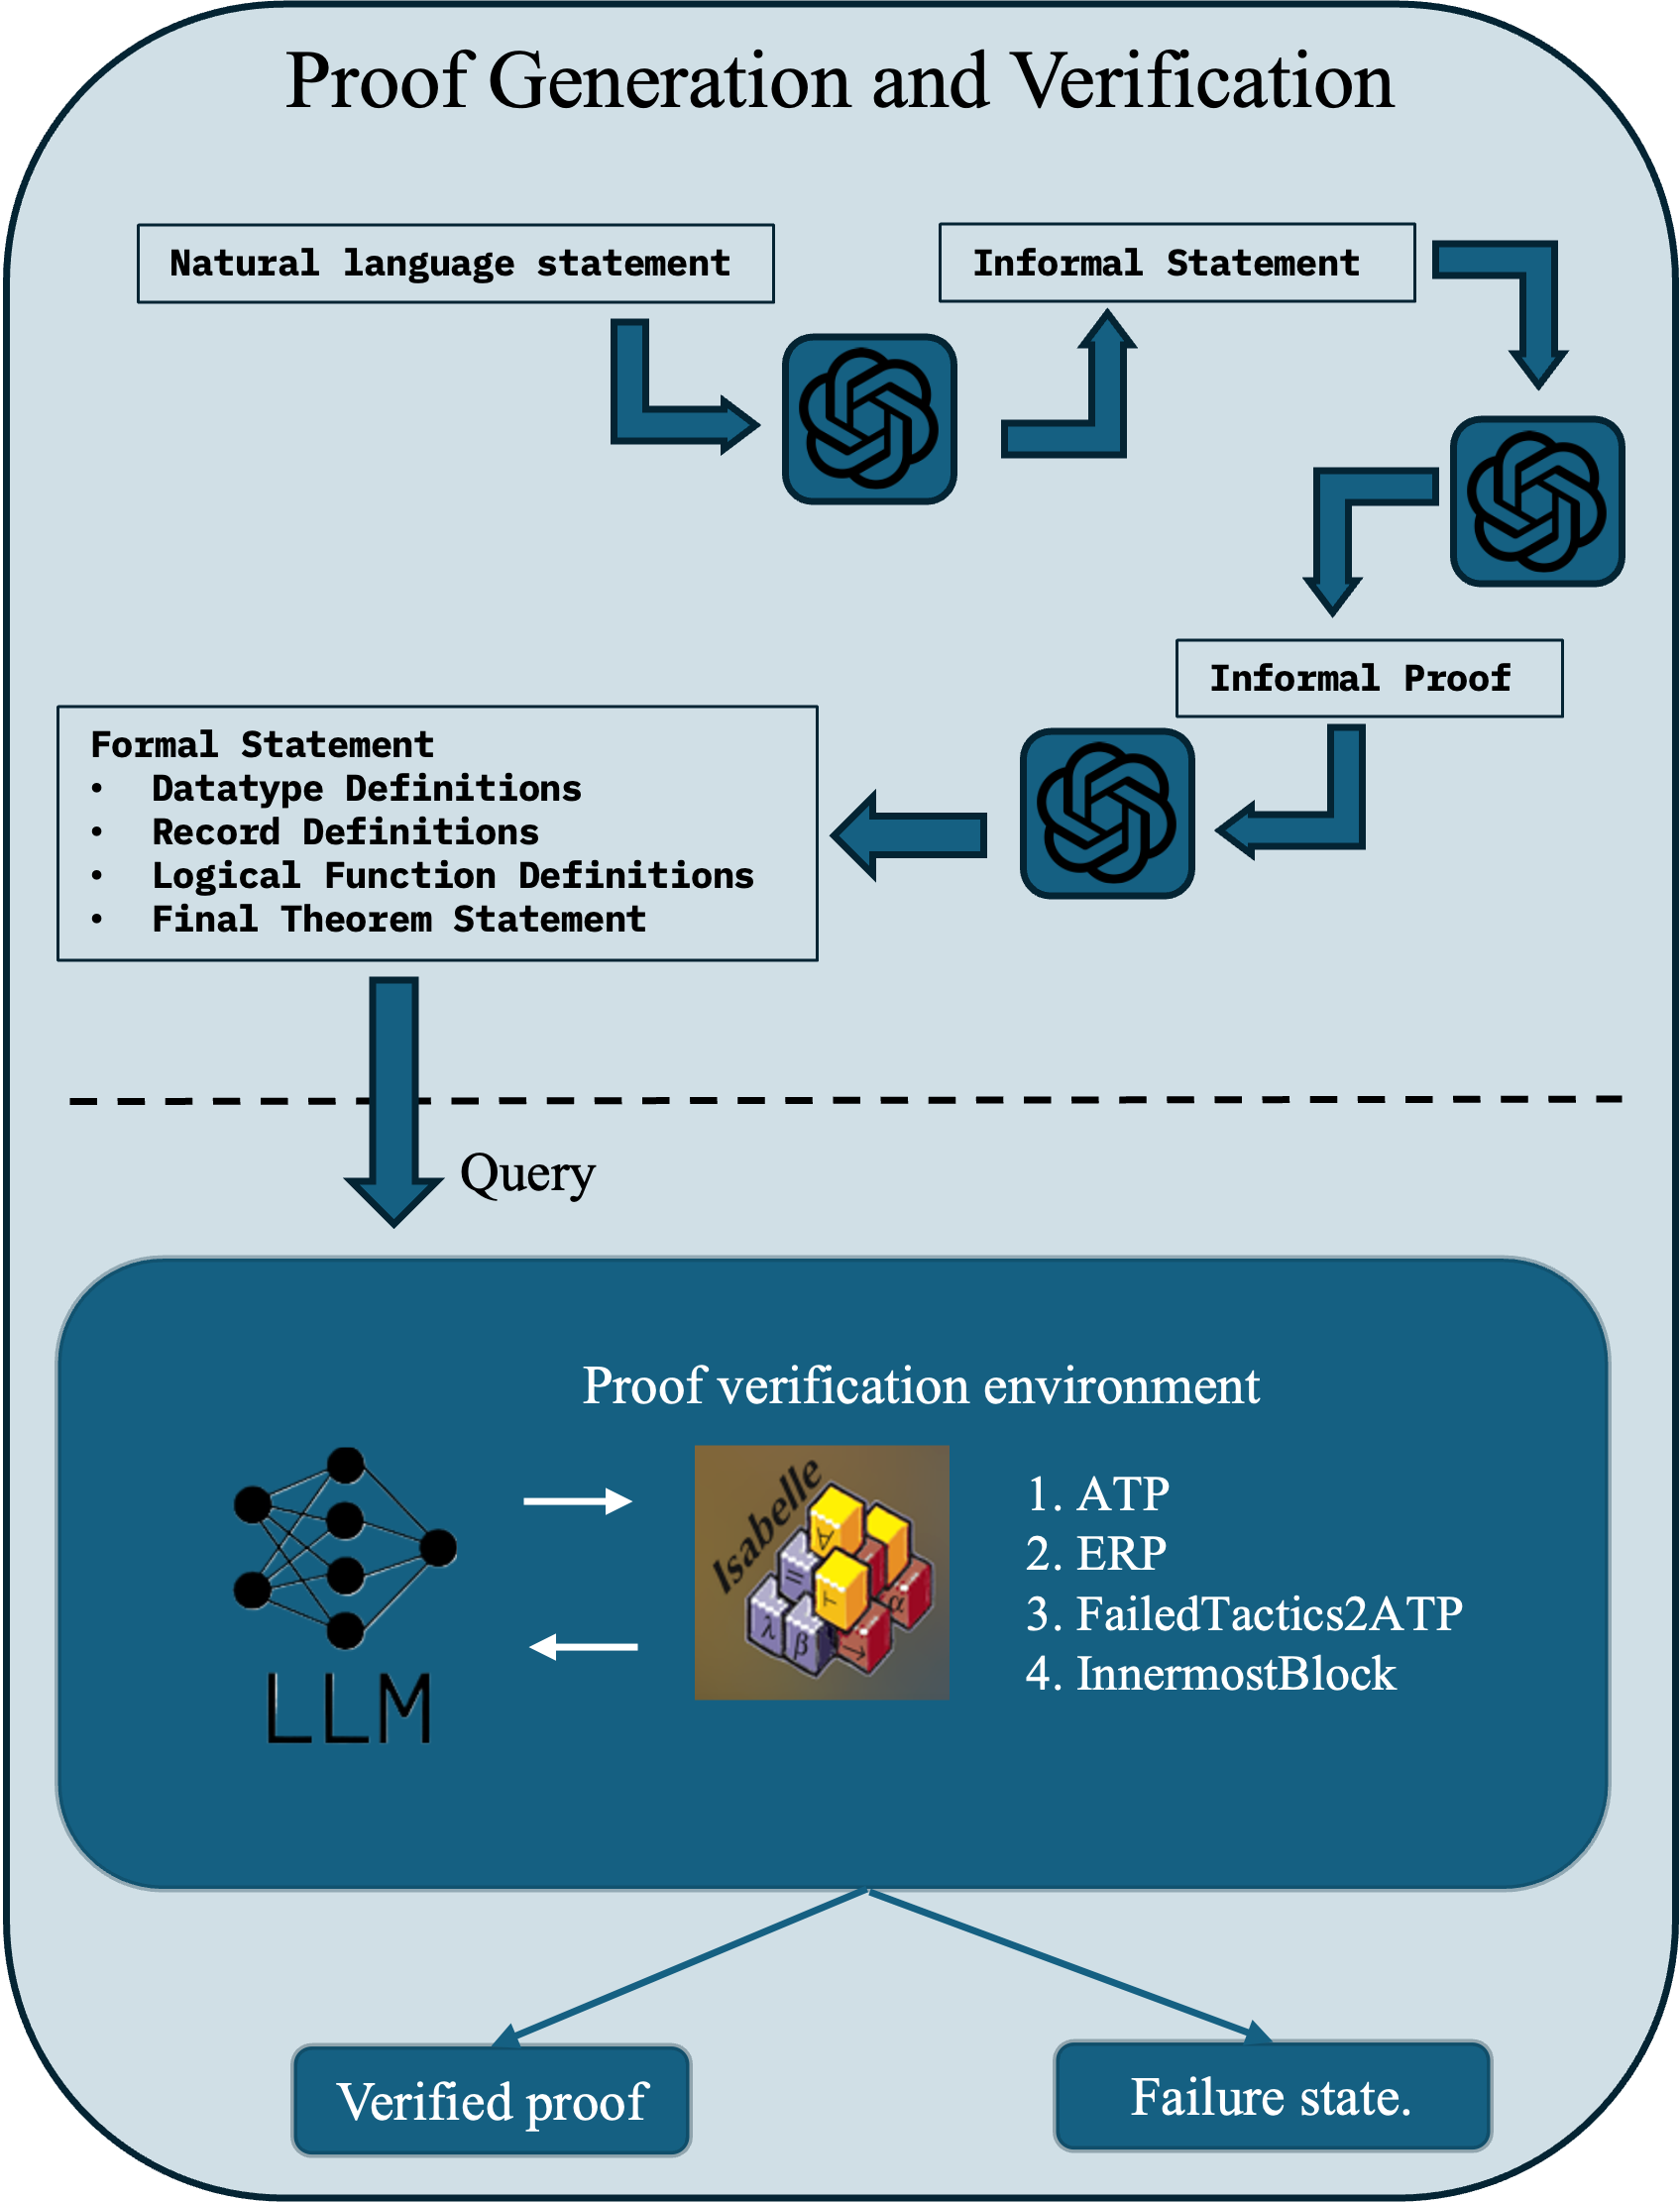
This diagram illustrates a workflow for proof generation and verification, involving natural language statements, formal statements, a Large Language Model (LLM), and a proof verification environment (Isabelle). The process appears to be iterative, with feedback loops between the different stages.
### Components/Axes
The diagram consists of several key components:
* **Natural language statement:** A rectangular box at the top-left.
* **Informal Statement:** A rectangular box at the top-right.
* **Formal Statement:** A pentagonal box in the center-left, listing:
* Datatype Definitions
* Record Definitions
* Logical Function Definitions
* Final Theorem Statement
* **Informal Proof:** A rectangular box in the center-right.
* **LLM:** A large, dark gray circular area at the bottom-left, represented as a network of interconnected nodes.
* **Proof verification environment:** A complex, multi-colored structure (Isabelle) at the bottom-center, resembling a stack of blocks.
* **Verified proof:** An oval shape at the bottom-left, connected to the LLM by a green arrow.
* **Failure state:** An oval shape at the bottom-right, connected to the LLM by a red arrow.
* **Arrows:** Curved arrows indicate the flow of information between the components.
* **Query:** A label positioned along a dashed arrow pointing from the Formal Statement to the LLM.
* **Isabelle:** Label within the proof verification environment.
* **Legend:** A numbered list to the right of the proof verification environment:
1. ATP
2. ERP
3. FailedTactics2ATP
4. InnermostBlock
### Detailed Analysis or Content Details
The diagram depicts the following flow:
1. A **Natural language statement** is transformed into an **Informal Statement**. This transformation is represented by a curved arrow with a swirl pattern.
2. The **Informal Statement** is then used to generate an **Informal Proof**, again with a curved arrow and swirl pattern.
3. The **Informal Proof** is formalized into a **Formal Statement**, which includes Datatype Definitions, Record Definitions, Logical Function Definitions, and the Final Theorem Statement. This transformation is also represented by a curved arrow with a swirl pattern.
4. A **Query** is sent from the **Formal Statement** to the **LLM**.
5. The **LLM** interacts with the **Proof verification environment (Isabelle)**. The interaction is bidirectional, indicated by two arrows.
6. The **Proof verification environment** outputs either a **Verified proof** (green arrow) or a **Failure state** (red arrow) back to the **LLM**.
The **Proof verification environment (Isabelle)** is composed of four distinct colored blocks:
* A red block (labeled 3. FailedTactics2ATP)
* A yellow block (labeled 4. InnermostBlock)
* A blue block (labeled 1. ATP)
* A green block (labeled 2. ERP)
### Key Observations
The diagram emphasizes the iterative nature of proof generation and verification. The LLM plays a central role in bridging the gap between formal and informal representations of proofs. The proof verification environment appears to be a complex system with multiple components, each potentially contributing to the verification process. The color-coding of the Isabelle blocks suggests different functionalities or stages within the verification process.
### Interpretation
This diagram illustrates a modern approach to automated theorem proving, leveraging the capabilities of LLMs to assist in the process. The LLM acts as an intermediary, translating between human-readable natural language and the formal language required for verification. The Isabelle environment provides a rigorous framework for checking the correctness of proofs. The feedback loop between the LLM and Isabelle suggests an iterative refinement process, where the LLM learns from its mistakes and improves its ability to generate valid proofs. The diagram highlights the challenges of bridging the gap between informal mathematical reasoning and formal proof systems. The use of color-coding within Isabelle suggests a modular design, allowing for different verification strategies to be employed. The diagram does not provide any quantitative data, but rather focuses on the conceptual flow of information and the key components involved in the process. It is a high-level overview, and further details would be needed to understand the specific algorithms and techniques used in each stage.