## Chart Type: Step-wise Loss vs. Tokens (B)
### Overview
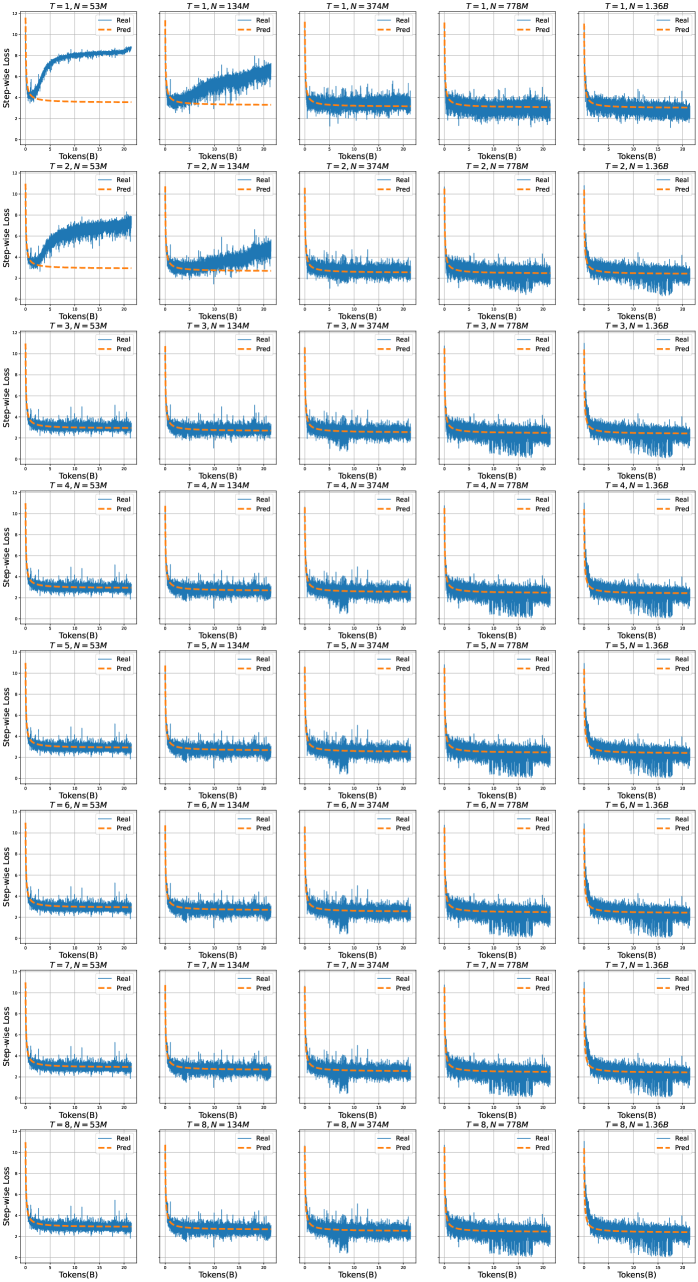
The image presents a grid of line charts, each displaying the "Step-wise Loss" against "Tokens (B)". The charts are organized in a matrix format, with each row representing a different value of 'T' (ranging from 1 to 8) and each column representing a different value of 'N' (53M, 134M, 374M, 778M, and 1.368). Each chart contains two data series: "Real" (blue line) and "Pred" (orange dashed line).
### Components/Axes
* **Y-axis (Step-wise Loss):** The vertical axis is labeled "Step-wise Loss". The scale ranges from approximately 0 to 12 in most charts.
* **X-axis (Tokens(B)):** The horizontal axis is labeled "Tokens(B)". The scale ranges from 0 to 20 in all charts.
* **Titles:** Each chart has a title in the format "T=[value], N=[value]". 'T' ranges from 1 to 8, and 'N' takes the values 53M, 134M, 374M, 778M, and 1.368.
* **Legend:** Each chart has a legend in the top-right corner indicating "Real" (blue line) and "Pred" (orange dashed line).
### Detailed Analysis
The data is presented as a grid of plots, where each plot shows the step-wise loss as a function of tokens. The plots are arranged by 'T' (rows) and 'N' (columns).
**Row Analysis (Varying T):**
* As 'T' increases from 1 to 8, the initial fluctuations in the "Real" loss curve seem to diminish, and the curves become smoother.
**Column Analysis (Varying N):**
* As 'N' increases from 53M to 1.368, the "Real" loss curves generally show a faster initial drop and stabilization. The "Pred" curves also appear to converge more quickly to a stable value.
**Individual Chart Analysis:**
* **T=1, N=53M:** The "Real" loss starts around 4, increases to approximately 9 around 5 Tokens(B), and then fluctuates between 6 and 8. The "Pred" loss is relatively stable around 4.
* **T=1, N=134M:** The "Real" loss starts around 6, fluctuates significantly, and stabilizes around 4. The "Pred" loss is relatively stable around 4.
* **T=1, N=374M:** The "Real" loss starts high, drops rapidly, and stabilizes around 2. The "Pred" loss is relatively stable around 2.
* **T=1, N=778M:** The "Real" loss starts high, drops rapidly, and stabilizes around 2. The "Pred" loss is relatively stable around 2.
* **T=1, N=1.368:** The "Real" loss starts high, drops rapidly, and stabilizes around 2. The "Pred" loss is relatively stable around 2.
* **T=8, N=53M:** The "Real" loss starts around 4, fluctuates slightly, and stabilizes around 4. The "Pred" loss is relatively stable around 4.
* **T=8, N=134M:** The "Real" loss starts around 4, fluctuates slightly, and stabilizes around 4. The "Pred" loss is relatively stable around 4.
* **T=8, N=374M:** The "Real" loss starts high, drops rapidly, and stabilizes around 2. The "Pred" loss is relatively stable around 2.
* **T=8, N=778M:** The "Real" loss starts high, drops rapidly, and stabilizes around 2. The "Pred" loss is relatively stable around 2.
* **T=8, N=1.368:** The "Real" loss starts high, drops rapidly, and stabilizes around 2. The "Pred" loss is relatively stable around 2.
**General Trends:**
* For lower values of 'N' (53M and 134M), the "Real" loss curves exhibit more fluctuations, especially at lower 'T' values.
* For higher values of 'N' (374M, 778M, and 1.368), the "Real" loss curves tend to decrease rapidly and stabilize at a lower value.
* The "Pred" loss curves are generally more stable and have lower values compared to the "Real" loss curves, especially for lower 'N' values.
### Key Observations
* The "Real" loss curves show a clear trend of decreasing and stabilizing as 'N' increases.
* The "Pred" loss curves are generally more stable and lower than the "Real" loss curves.
* The fluctuations in the "Real" loss curves decrease as 'T' increases.
### Interpretation
The charts illustrate the relationship between "Step-wise Loss" and "Tokens (B)" for different values of 'T' and 'N'. 'T' likely represents the training step or epoch, while 'N' represents the dataset size or number of parameters.
The data suggests that:
* Increasing the dataset size ('N') leads to a faster decrease and stabilization of the "Real" loss, indicating better model convergence.
* As the training progresses ('T' increases), the model becomes more stable, as evidenced by the reduced fluctuations in the "Real" loss curves.
* The "Pred" loss being lower and more stable than the "Real" loss suggests that the model is generalizing well and not overfitting to the training data.
The observed trends indicate that larger datasets and longer training times contribute to improved model performance and stability. The plots provide a visual representation of how the model's learning process is affected by these factors.