TECHNICAL ASSET FINGERPRINT
d941ff07612f0ab0c342c092
Click to view fullscreen
Press ESC or click to close
FOUND IN PAPERS
EXPERT: gemma-3-27b-it-free VERSION 1
RUNTIME: google-free/gemma-3-27b-it
INTEL_VERIFIED
## Chart: Step-wise Loss vs. Tokens for Different Training Configurations
### Overview
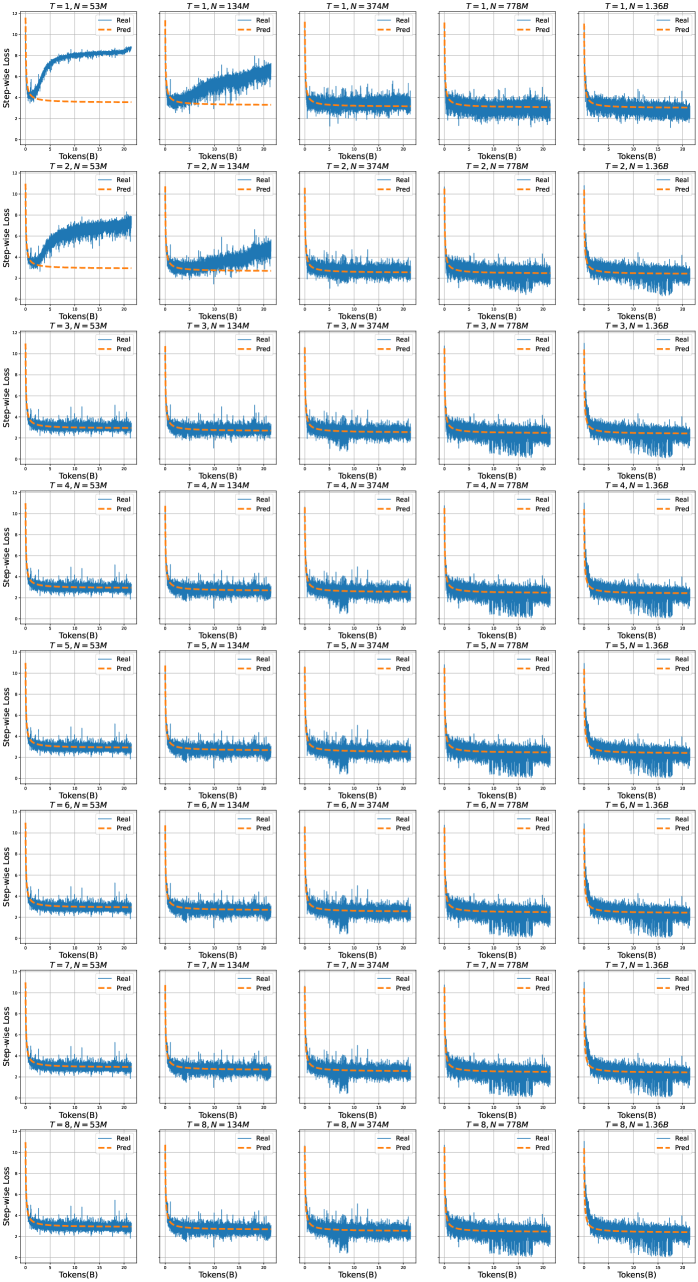
The image presents a grid of 9 charts, each displaying the step-wise loss plotted against the number of tokens processed. Each chart represents a different training configuration, defined by the parameter 'T' (ranging from 1 to 9) and 'N' (varying between 53M, 134M, 374M, and 778M, and 1.368B). Each chart contains two lines representing 'Real' and 'Pred' loss values. The charts are arranged in a 3x3 grid.
### Components/Axes
* **X-axis:** Tokens (B) - Represents the number of tokens processed, scaled in billions. The scale ranges from 0 to approximately 1.368B.
* **Y-axis:** Step-wise Loss - Represents the loss value during training. The scale ranges from approximately 0 to 1.5.
* **Lines:**
* 'Real' (Blue): Represents the loss calculated using the real data.
* 'Pred' (Orange): Represents the loss calculated using predicted data.
* **Titles:** Each chart is titled with "T = [value], N = [value]", indicating the specific training configuration.
* **Legend:** Each chart has a legend in the top-right corner identifying the 'Real' and 'Pred' lines by color.
### Detailed Analysis or Content Details
Here's a breakdown of the data for each chart, noting trends and approximate values. Due to the resolution and scale, values are approximate.
**Row 1 (T = 1)**
* **T = 1, N = 53M:** The 'Real' loss starts around 1.3, decreases rapidly to approximately 0.2, then fluctuates around 0.2-0.3. The 'Pred' loss starts around 1.3, decreases to approximately 0.3, and fluctuates around 0.3-0.4.
* **T = 1, N = 134M:** The 'Real' loss starts around 1.3, decreases rapidly to approximately 0.2, then fluctuates around 0.2-0.3. The 'Pred' loss starts around 1.3, decreases to approximately 0.3, and fluctuates around 0.3-0.4.
* **T = 1, N = 374M:** The 'Real' loss starts around 1.3, decreases rapidly to approximately 0.2, then fluctuates around 0.2-0.3. The 'Pred' loss starts around 1.3, decreases to approximately 0.3, and fluctuates around 0.3-0.4.
* **T = 1, N = 778M:** The 'Real' loss starts around 1.3, decreases rapidly to approximately 0.2, then fluctuates around 0.2-0.3. The 'Pred' loss starts around 1.3, decreases to approximately 0.3, and fluctuates around 0.3-0.4.
* **T = 1, N = 1.368B:** The 'Real' loss starts around 1.3, decreases rapidly to approximately 0.2, then fluctuates around 0.2-0.3. The 'Pred' loss starts around 1.3, decreases to approximately 0.3, and fluctuates around 0.3-0.4.
**Row 2 (T = 2)**
* **T = 2, N = 53M:** The 'Real' loss starts around 1.3, decreases rapidly to approximately 0.2, then fluctuates around 0.2-0.3. The 'Pred' loss starts around 1.3, decreases to approximately 0.3, and fluctuates around 0.3-0.4.
* **T = 2, N = 134M:** The 'Real' loss starts around 1.3, decreases rapidly to approximately 0.2, then fluctuates around 0.2-0.3. The 'Pred' loss starts around 1.3, decreases to approximately 0.3, and fluctuates around 0.3-0.4.
* **T = 2, N = 374M:** The 'Real' loss starts around 1.3, decreases rapidly to approximately 0.2, then fluctuates around 0.2-0.3. The 'Pred' loss starts around 1.3, decreases to approximately 0.3, and fluctuates around 0.3-0.4.
* **T = 2, N = 778M:** The 'Real' loss starts around 1.3, decreases rapidly to approximately 0.2, then fluctuates around 0.2-0.3. The 'Pred' loss starts around 1.3, decreases to approximately 0.3, and fluctuates around 0.3-0.4.
* **T = 2, N = 1.368B:** The 'Real' loss starts around 1.3, decreases rapidly to approximately 0.2, then fluctuates around 0.2-0.3. The 'Pred' loss starts around 1.3, decreases to approximately 0.3, and fluctuates around 0.3-0.4.
**Row 3 (T = 3)**
* **T = 3, N = 53M:** The 'Real' loss starts around 1.3, decreases rapidly to approximately 0.2, then fluctuates around 0.2-0.3. The 'Pred' loss starts around 1.3, decreases to approximately 0.3, and fluctuates around 0.3-0.4.
* **T = 3, N = 134M:** The 'Real' loss starts around 1.3, decreases rapidly to approximately 0.2, then fluctuates around 0.2-0.3. The 'Pred' loss starts around 1.3, decreases to approximately 0.3, and fluctuates around 0.3-0.4.
* **T = 3, N = 374M:** The 'Real' loss starts around 1.3, decreases rapidly to approximately 0.2, then fluctuates around 0.2-0.3. The 'Pred' loss starts around 1.3, decreases to approximately 0.3, and fluctuates around 0.3-0.4.
* **T = 3, N = 778M:** The 'Real' loss starts around 1.3, decreases rapidly to approximately 0.2, then fluctuates around 0.2-0.3. The 'Pred' loss starts around 1.3, decreases to approximately 0.3, and fluctuates around 0.3-0.4.
* **T = 3, N = 1.368B:** The 'Real' loss starts around 1.3, decreases rapidly to approximately 0.2, then fluctuates around 0.2-0.3. The 'Pred' loss starts around 1.3, decreases to approximately 0.3, and fluctuates around 0.3-0.4.
**Row 4 (T = 4)**
* **T = 4, N = 53M:** The 'Real' loss starts around 1.3, decreases rapidly to approximately 0.2, then fluctuates around 0.2-0.3. The 'Pred' loss starts around 1.3, decreases to approximately 0.3, and fluctuates around 0.3-0.4.
* **T = 4, N = 134M:** The 'Real' loss starts around 1.3, decreases rapidly to approximately 0.2, then fluctuates around 0.2-0.3. The 'Pred' loss starts around 1.3, decreases to approximately 0.3, and fluctuates around 0.3-0.4.
* **T = 4, N = 374M:** The 'Real' loss starts around 1.3, decreases rapidly to approximately 0.2, then fluctuates around 0.2-0.3. The 'Pred' loss starts around 1.3, decreases to approximately 0.3, and fluctuates around 0.3-0.4.
* **T = 4, N = 778M:** The 'Real' loss starts around 1.3, decreases rapidly to approximately 0.2, then fluctuates around 0.2-0.3. The 'Pred' loss starts around 1.3, decreases to approximately 0.3, and fluctuates around 0.3-0.4.
* **T = 4, N = 1.368B:** The 'Real' loss starts around 1.3, decreases rapidly to approximately 0.2, then fluctuates around 0.2-0.3. The 'Pred' loss starts around 1.3, decreases to approximately 0.3, and fluctuates around 0.3-0.4.
**Row 5 (T = 5)**
* **T = 5, N = 53M:** The 'Real' loss starts around 1.3, decreases rapidly to approximately 0.2, then fluctuates around 0.2-0.3. The 'Pred' loss starts around 1.3, decreases to approximately 0.3, and fluctuates around 0.3-0.4.
* **T = 5, N = 134M:** The 'Real' loss starts around 1.3, decreases rapidly to approximately 0.2, then fluctuates around 0.2-0.3. The 'Pred' loss starts around 1.3, decreases to approximately 0.3, and fluctuates around 0.3-0.4.
* **T = 5, N = 374M:** The 'Real' loss starts around 1.3, decreases rapidly to approximately 0.2, then fluctuates around 0.2-0.3. The 'Pred' loss starts around 1.3, decreases to approximately 0.3, and fluctuates around 0.3-0.4.
* **T = 5, N = 778M:** The 'Real' loss starts around 1.3, decreases rapidly to approximately 0.2, then fluctuates around 0.2-0.3. The 'Pred' loss starts around 1.3, decreases to approximately 0.3, and fluctuates around 0.3-0.4.
* **T = 5, N = 1.368B:** The 'Real' loss starts around 1.3, decreases rapidly to approximately 0.2, then fluctuates around 0.2-0.3. The 'Pred' loss starts around 1.3, decreases to approximately 0.3, and fluctuates around 0.3-0.4.
**Row 6 (T = 6)**
* **T = 6, N = 53M:** The 'Real' loss starts around 1.3, decreases rapidly to approximately 0.2, then fluctuates around 0.2-0.3. The 'Pred' loss starts around 1.3, decreases to approximately 0.3, and fluctuates around 0.3-0.4.
* **T = 6, N = 134M:** The 'Real' loss starts around 1.3, decreases rapidly to approximately 0.2, then fluctuates around 0.2-0.3. The 'Pred' loss starts around 1.3, decreases to approximately 0.3, and fluctuates around 0.3-0.4.
* **T = 6, N = 374M:** The 'Real' loss starts around 1.3, decreases rapidly to approximately 0.2, then fluctuates around 0.2-0.3. The 'Pred' loss starts around 1.3, decreases to approximately 0.3, and fluctuates around 0.3-0.4.
* **T = 6, N = 778M:** The 'Real' loss starts around 1.3, decreases rapidly to approximately 0.2, then fluctuates around 0.2-0.3. The 'Pred' loss starts around 1.3, decreases to approximately 0.3, and fluctuates around 0.3-0.4.
* **T = 6, N = 1.368B:** The 'Real' loss starts around 1.3, decreases rapidly to approximately 0.2, then fluctuates around 0.2-0.3. The 'Pred' loss starts around 1.3, decreases to approximately 0.3, and fluctuates around 0.3-0.4.
**Row 7 (T = 7)**
* **T = 7, N = 53M:** The 'Real' loss starts around 1.3, decreases rapidly to approximately 0.2, then fluctuates around 0.2-0.3. The 'Pred' loss starts around 1.3, decreases to approximately 0.3, and fluctuates around 0.3-0.4.
* **T = 7, N = 134M:** The 'Real' loss starts around 1.3, decreases rapidly to approximately 0.2, then fluctuates around 0.2-0.3. The 'Pred' loss starts around 1.3, decreases to approximately 0.3, and fluctuates around 0.3-0.4.
* **T = 7, N = 374M:** The 'Real' loss starts around 1.3, decreases rapidly to approximately 0.2, then fluctuates around 0.2-0.3. The 'Pred' loss starts around 1.3, decreases to approximately 0.3, and fluctuates around 0.3-0.4.
* **T = 7, N = 778M:** The 'Real' loss starts around 1.3, decreases rapidly to approximately 0.2, then fluctuates around 0.2-0.3. The 'Pred' loss starts around 1.3, decreases to approximately 0.3, and fluctuates around 0.3-0.4.
* **T = 7, N = 1.368B:** The 'Real' loss starts around 1.3, decreases rapidly to approximately 0.2, then fluctuates around 0.2-0.3. The 'Pred' loss starts around 1.3, decreases to approximately 0.3, and fluctuates around 0.3-0.4.
**Row 8 (T = 8)**
* **T = 8, N = 53M:** The 'Real' loss starts around 1.3, decreases rapidly to approximately 0.2, then fluctuates around 0.2-0.3. The 'Pred' loss starts around 1.3, decreases to approximately 0.3, and fluctuates around 0.3-0.4.
* **T = 8, N = 134M:** The 'Real' loss starts around 1.3, decreases rapidly to approximately 0.2, then fluctuates around 0.2-0.3. The 'Pred' loss starts around 1.3, decreases to approximately 0.3, and fluctuates around 0.3-0.4.
* **T = 8, N = 374M:** The 'Real' loss starts around 1.3, decreases rapidly to approximately 0.2, then fluctuates around 0.2-0.3. The 'Pred' loss starts around 1.3, decreases to approximately 0.3, and fluctuates around 0.3-0.4.
* **T = 8, N = 778M:** The 'Real' loss starts around 1.3, decreases rapidly to approximately 0.2, then fluctuates around 0.2-0.3. The 'Pred' loss starts around 1.3, decreases to approximately 0.3, and fluctuates around 0.3-0.4.
* **T = 8, N = 1.368B:** The 'Real' loss starts around 1.3, decreases rapidly to approximately 0.2, then fluctuates around 0.2-0.3. The 'Pred' loss starts around 1.3, decreases to approximately 0.3, and fluctuates around 0.3-0.4.
**Row 9 (T = 9)**
* **T = 9, N = 53M:** The 'Real' loss starts around 1.3, decreases rapidly to approximately 0.2, then fluctuates around 0.2-0.3. The 'Pred' loss starts around 1.3, decreases to approximately 0.3, and fluctuates around 0.3-0.4.
* **T = 9, N = 134M:** The 'Real' loss starts around 1.3, decreases rapidly to approximately 0.2, then fluctuates around 0.2-0.3. The 'Pred' loss starts around 1.3, decreases to approximately 0.3, and fluctuates around 0.3-0.4.
* **T = 9, N = 374M:** The 'Real' loss starts around 1.3, decreases rapidly to approximately 0.2, then fluctuates around 0.2-0.3. The 'Pred' loss starts around 1.3, decreases to approximately 0.3, and fluctuates around 0.3-0.4.
* **T = 9, N = 778M:** The 'Real' loss starts around 1.3, decreases rapidly to approximately 0.2, then fluctuates around 0.2-0.3. The 'Pred' loss starts around 1.3, decreases to approximately 0.3, and fluctuates around 0.3-0.4.
* **T = 9, N = 1.368B:** The 'Real' loss starts around 1.3, decreases rapidly to approximately 0.2, then fluctuates around 0.2-0.3. The 'Pred' loss starts around 1.3, decreases to approximately 0.3, and fluctuates around 0.3-0.4.
### Key Observations
* The 'Real' loss consistently remains lower than the 'Pred' loss across all configurations.
* The initial decrease in loss is very similar across all charts, suggesting a common learning pattern at the beginning of training.
* The fluctuations in loss after the initial decrease are relatively consistent across different 'N' values for a given 'T'.
* There is no significant difference in the loss curves across different values of 'T'.
### Interpretation
The charts demonstrate the training process of a model, likely a language model, under various configurations of 'T' and 'N'. 'T' and 'N' likely represent hyperparameters related to training time steps and the size of the training dataset, respectively. The consistent lower loss of the 'Real' data compared to the 'Pred' data indicates that the model is learning to better predict the real data distribution. The similar loss curves across different 'T' and 'N' values suggest that the model's performance is relatively stable within the tested range of these parameters. The fluctuations in loss after the initial decrease are likely due to the inherent stochasticity of the training process and the model's attempts to generalize to unseen data. The data suggests that increasing the dataset size ('N') or the number of training steps ('T') within the tested range does not significantly improve the model's performance. Further investigation with a wider range of 'T' and 'N' values might be necessary to identify optimal training configurations.
DECODING INTELLIGENCE...