## Line Charts: Best-of-N Performance on AIME '24 and MATH-500
### Overview
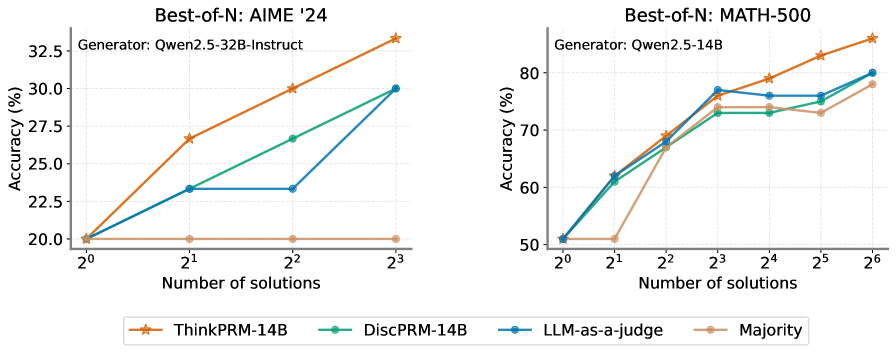
The image contains two line charts comparing the accuracy (%) of different models (ThinkPRM-14B, DiscPRM-14B, LLM-as-a-judge, and Majority) against the number of solutions (2^0 to 2^3 for AIME '24 and 2^0 to 2^6 for MATH-500). The left chart shows results for "Best-of-N: AIME '24" with the generator "Qwen2.5-32B-Instruct", while the right chart shows results for "Best-of-N: MATH-500" with the generator "Qwen2.5-14B".
### Components/Axes
**Left Chart (AIME '24):**
* **Title:** Best-of-N: AIME '24
* **Subtitle:** Generator: Qwen2.5-32B-Instruct
* **Y-axis:** Accuracy (%) - Scale from 20.0 to 32.5, with increments of 2.5.
* **X-axis:** Number of solutions - Values are 2^0, 2^1, 2^2, and 2^3.
* **Legend (bottom):**
* ThinkPRM-14B (Orange line with star markers)
* DiscPRM-14B (Green line with circle markers)
* LLM-as-a-judge (Blue line with circle markers)
* Majority (Tan line with circle markers)
**Right Chart (MATH-500):**
* **Title:** Best-of-N: MATH-500
* **Subtitle:** Generator: Qwen2.5-14B
* **Y-axis:** Accuracy (%) - Scale from 50 to 80, with increments of 10.
* **X-axis:** Number of solutions - Values are 2^0, 2^1, 2^2, 2^3, 2^4, 2^5, and 2^6.
* **Legend (bottom):** Same as the left chart.
### Detailed Analysis
**Left Chart (AIME '24):**
* **ThinkPRM-14B (Orange):** Starts at approximately 20% accuracy at 2^0 solutions, increases to approximately 27% at 2^1 solutions, and continues to increase to approximately 33% at 2^3 solutions.
* **DiscPRM-14B (Green):** Starts at approximately 20% accuracy at 2^0 solutions, increases to approximately 27% at 2^2 solutions, and continues to increase to approximately 30% at 2^3 solutions.
* **LLM-as-a-judge (Blue):** Starts at approximately 20% accuracy at 2^0 solutions, increases to approximately 23% at 2^1 solutions, remains constant at 23% at 2^2 solutions, and increases to approximately 30% at 2^3 solutions.
* **Majority (Tan):** Remains constant at approximately 20% accuracy across all solution counts.
**Right Chart (MATH-500):**
* **ThinkPRM-14B (Orange):** Starts at approximately 50% accuracy at 2^0 solutions, increases to approximately 68% at 2^1 solutions, increases to approximately 74% at 2^2 solutions, remains constant at 74% at 2^3 solutions, decreases to approximately 73% at 2^5 solutions, and increases to approximately 79% at 2^6 solutions.
* **DiscPRM-14B (Green):** Starts at approximately 50% accuracy at 2^0 solutions, increases to approximately 62% at 2^1 solutions, increases to approximately 73% at 2^2 solutions, remains constant at 73% at 2^4 solutions, and increases to approximately 80% at 2^6 solutions.
* **LLM-as-a-judge (Blue):** Starts at approximately 50% accuracy at 2^0 solutions, increases to approximately 62% at 2^1 solutions, increases to approximately 77% at 2^2 solutions, remains constant at 77% at 2^3 solutions, decreases to approximately 76% at 2^4 solutions, and increases to approximately 79% at 2^6 solutions.
* **Majority (Tan):** Starts at approximately 50% accuracy at 2^0 solutions, remains constant at 50% at 2^1 solutions, increases to approximately 68% at 2^2 solutions, remains constant at 68% at 2^3 solutions, remains constant at 68% at 2^4 solutions, increases to approximately 73% at 2^5 solutions, and increases to approximately 79% at 2^6 solutions.
### Key Observations
* In the AIME '24 dataset, ThinkPRM-14B consistently outperforms the other models as the number of solutions increases. The Majority model remains constant and performs the worst.
* In the MATH-500 dataset, all models show a general increasing trend in accuracy as the number of solutions increases. The performance differences between the models are less pronounced compared to the AIME '24 dataset.
* The Majority model performs significantly better on the MATH-500 dataset compared to the AIME '24 dataset.
### Interpretation
The charts illustrate the performance of different language models on two distinct problem-solving tasks (AIME '24 and MATH-500) as the number of solutions considered increases. The AIME '24 results suggest that ThinkPRM-14B is particularly effective at leveraging multiple solutions to improve accuracy on this task, while the Majority model struggles. The MATH-500 results indicate that all models benefit from an increased number of solutions, with the Majority model showing a substantial improvement compared to its performance on AIME '24. This suggests that the MATH-500 task may be more amenable to simple aggregation strategies. The difference in generator models (Qwen2.5-32B-Instruct vs. Qwen2.5-14B) between the two datasets may also contribute to the observed performance variations.