\n
## Line Chart: Model Accuracy vs. Number of Solutions
### Overview
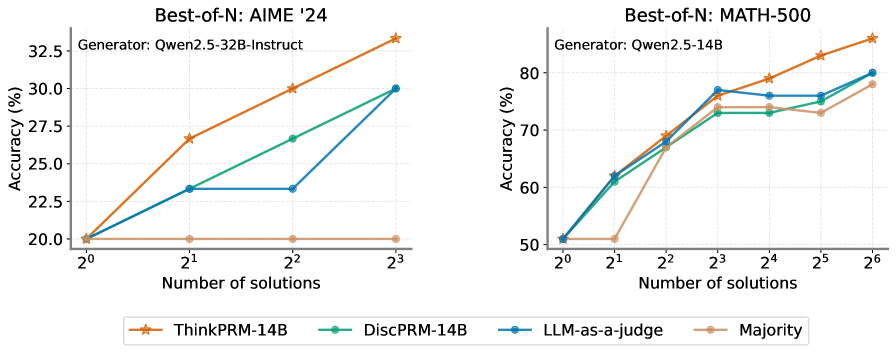
The image presents two line charts comparing the accuracy of different Large Language Models (LLMs) on two mathematical reasoning benchmarks: AIME '24 and MATH-500. The charts show how accuracy changes as the number of solutions generated by the models increases.
### Components/Axes
**Chart 1 (AIME '24):**
* **Title:** Best-of-N: AIME '24
* **Generator:** Qwen2.5-32B-Instruct
* **X-axis:** Number of solutions (labeled as 2⁰, 2¹, 2², 2³) – representing 1, 2, 4, and 8 solutions respectively.
* **Y-axis:** Accuracy (%) – ranging from approximately 20% to 33%.
* **Legend:**
* ThinkPRM-14B (Orange)
* DiscPRM-14B (Teal)
* LLM-as-a-judge (Gray)
* Majority (Peach)
**Chart 2 (MATH-500):**
* **Title:** Best-of-N: MATH-500
* **Generator:** Qwen2.5-14B
* **X-axis:** Number of solutions (labeled as 2¹, 2², 2³, 2⁴, 2⁵, 2⁶) – representing 2, 4, 8, 16, 32, and 64 solutions respectively.
* **Y-axis:** Accuracy (%) – ranging from approximately 50% to 85%.
* **Legend:**
* ThinkPRM-14B (Orange)
* DiscPRM-14B (Teal)
* LLM-as-a-judge (Gray)
* Majority (Peach)
The legend is positioned at the bottom-center of the image, spanning both charts.
### Detailed Analysis or Content Details
**Chart 1 (AIME '24):**
* **ThinkPRM-14B (Orange):** Starts at approximately 21% accuracy with 1 solution (2⁰), increases to roughly 26% with 2 solutions (2¹), then rises to about 29% with 4 solutions (2²), and finally reaches approximately 32.5% with 8 solutions (2³). The line slopes upward consistently.
* **DiscPRM-14B (Teal):** Begins at approximately 21% accuracy with 1 solution (2⁰), increases to around 25% with 2 solutions (2¹), then rises to about 29% with 4 solutions (2²), and reaches approximately 30.5% with 8 solutions (2³). The line slopes upward, but less steeply than ThinkPRM-14B.
* **LLM-as-a-judge (Gray):** Remains relatively flat, starting at approximately 21% with 1 solution (2⁰) and ending at around 23% with 8 solutions (2³).
* **Majority (Peach):** Starts at approximately 21% accuracy with 1 solution (2⁰) and remains relatively flat, fluctuating around 21-22% throughout.
**Chart 2 (MATH-500):**
* **ThinkPRM-14B (Orange):** Starts at approximately 51% accuracy with 2 solutions (2¹), increases sharply to around 74% with 4 solutions (2²), then rises to about 77% with 8 solutions (2³), plateaus around 77-78% with 16 solutions (2⁴), and finally reaches approximately 83% with 64 solutions (2⁶).
* **DiscPRM-14B (Teal):** Begins at approximately 51% accuracy with 2 solutions (2¹), increases to around 72% with 4 solutions (2²), then rises to about 75% with 8 solutions (2³), plateaus around 75-76% with 16 solutions (2⁴), and reaches approximately 79% with 64 solutions (2⁶).
* **LLM-as-a-judge (Gray):** Starts at approximately 51% accuracy with 2 solutions (2¹), increases to around 64% with 4 solutions (2²), then rises to about 73% with 8 solutions (2³), plateaus around 73-74% with 16 solutions (2⁴), and reaches approximately 75% with 64 solutions (2⁶).
* **Majority (Peach):** Starts at approximately 51% accuracy with 2 solutions (2¹), increases to around 68% with 4 solutions (2²), then rises to about 75% with 8 solutions (2³), plateaus around 75-76% with 16 solutions (2⁴), and reaches approximately 78% with 64 solutions (2⁶).
### Key Observations
* In both charts, increasing the number of solutions generally improves accuracy, but with diminishing returns.
* ThinkPRM-14B consistently outperforms the other methods on both benchmarks, especially as the number of solutions increases.
* LLM-as-a-judge and Majority perform similarly, but their accuracy gains are less pronounced than those of ThinkPRM-14B and DiscPRM-14B.
* The AIME '24 benchmark shows lower overall accuracy compared to the MATH-500 benchmark.
* The accuracy of all models on AIME '24 plateaus at a lower level than on MATH-500.
### Interpretation
These charts demonstrate the effectiveness of generating multiple solutions to mathematical problems and then selecting the best one. The "Best-of-N" approach, where N represents the number of solutions, significantly improves accuracy compared to relying on a single solution. The Qwen2.5 models used as generators appear to be effective in producing diverse solutions.
The superior performance of ThinkPRM-14B suggests that its prompting strategy or architecture is particularly well-suited for mathematical reasoning. The relatively flat performance of LLM-as-a-judge indicates that simply using an LLM to judge the correctness of solutions is not as effective as more sophisticated methods like ThinkPRM-14B or DiscPRM-14B.
The diminishing returns observed as the number of solutions increases suggest that there is a point at which generating additional solutions provides only marginal improvements in accuracy. This highlights the importance of balancing computational cost with performance gains. The difference in overall accuracy between the two benchmarks (AIME '24 and MATH-500) suggests that AIME '24 is a more challenging benchmark, requiring more sophisticated reasoning abilities.