## Line Charts: Best-of-N Performance Comparison
### Overview
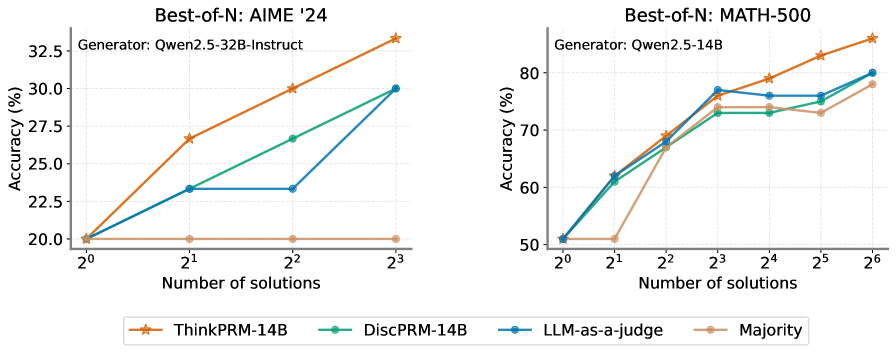
The image contains two line charts comparing the accuracy of different AI models across increasing numbers of solutions. The left chart focuses on AIME '24 (American Invitational Mathematics Examination 2024), while the right chart evaluates MATH-500. Both charts use logarithmic scaling on the x-axis (number of solutions) and linear scaling on the y-axis (accuracy percentage).
### Components/Axes
**Left Chart (AIME '24):**
- **X-axis**: Number of solutions (2⁰ to 2³)
- **Y-axis**: Accuracy (%) (20% to 32.5%)
- **Legend**:
- Orange ★: ThinkPRM-14B
- Green ●: DiscPRM-14B
- Blue ○: LLM-as-a-judge
- Brown ●●: Majority
**Right Chart (MATH-500):**
- **X-axis**: Number of solutions (2⁰ to 2⁶)
- **Y-axis**: Accuracy (%) (50% to 80%)
- **Legend**: Same color coding as above
### Detailed Analysis
**AIME '24 Chart:**
1. **ThinkPRM-14B (Orange ★)**:
- Starts at 20% (2⁰)
- Increases linearly to 32.5% at 2³
- Steepest slope among all series
2. **DiscPRM-14B (Green ●)**:
- Starts at 20% (2⁰)
- Reaches 27% at 2²
- Jumps to 30% at 2³
3. **LLM-as-a-judge (Blue ○)**:
- Starts at 20% (2⁰)
- Plateaus at 22.5% until 2²
- Sharp increase to 30% at 2³
4. **Majority (Brown ●●)**:
- Remains flat at 20% across all x-values
**MATH-500 Chart:**
1. **ThinkPRM-14B (Orange ★)**:
- Starts at 50% (2⁰)
- Reaches 70% at 2²
- Gradual increase to 85% at 2⁶
2. **DiscPRM-14B (Green ●)**:
- Starts at 50% (2⁰)
- Reaches 65% at 2²
- Steady rise to 75% at 2⁶
3. **LLM-as-a-judge (Blue ○)**:
- Starts at 50% (2⁰)
- Peaks at 75% at 2³
- Dips to 72% at 2⁴
- Recovers to 80% at 2⁶
4. **Majority (Brown ●●)**:
- Starts at 50% (2⁰)
- Jumps to 60% at 2²
- Gradual increase to 75% at 2⁶
### Key Observations
1. **Performance Trends**:
- All methods show improved accuracy with more solutions
- ThinkPRM-14B dominates in AIME '24 (32.5% vs 30% for DiscPRM-14B)
- LLM-as-a-judge underperforms in early stages (2⁰-2²) but matches ThinkPRM-14B at 2³ in AIME '24
- Majority method lags behind specialized models in both datasets
2. **Dataset Differences**:
- AIME '24 shows steeper accuracy gains (20%→32.5%) vs MATH-500 (50%→85%)
- LLM-as-a-judge exhibits volatility in MATH-500 (peak at 2³, dip at 2⁴)
3. **Outliers**:
- Majority method's flat performance in AIME '24 suggests limited utility
- LLM-as-a-judge's dip at 2⁴ in MATH-500 indicates potential instability
### Interpretation
The charts demonstrate that specialized models (ThinkPRM-14B, DiscPRM-14B) consistently outperform generalist approaches (LLM-as-a-judge, Majority) across both datasets. The logarithmic scaling reveals that accuracy improvements follow power-law distributions, with diminishing returns at higher solution counts.
In AIME '24, ThinkPRM-14B's linear scaling suggests optimal performance at maximum solution count (2³). For MATH-500, the extended solution range (up to 2⁶) shows ThinkPRM-14B maintaining superiority despite increased complexity. The LLM-as-a-judge's volatility in MATH-500 may indicate challenges with scaling to larger problem sets, while the Majority method's flat performance in AIME '24 suggests fundamental limitations in its approach.
These results highlight the importance of model specialization for mathematical reasoning tasks, with ThinkPRM-14B emerging as the most reliable performer across both datasets.